Who are the undecided voters in 2016? Mormon women, wealthy Latinos, Midwestern white women
Posted: July 7, 2016 Filed under: Dunham's Discourses, The Index, U.S. politics | Tags: 2016 presidential race, American politics, Bernie Sanders, Democratic Party, Donald Trump, Hillary Clinton, Republican Party, Undecided voters Leave a comment![]() Welcome to the third installment of The Index, a series of posts analyzing the latest polling data through the lens of 100 micro-targeted demographic groups. Today, we look at the voters who can’t make up their minds.
Welcome to the third installment of The Index, a series of posts analyzing the latest polling data through the lens of 100 micro-targeted demographic groups. Today, we look at the voters who can’t make up their minds.
The presidential campaign polling has been remarkable stable over the past month — despite temporary blips — but the number of voters who are not supporting either Hillary Clinton or Donald Trump remains historically high for the summer before a presidential election.
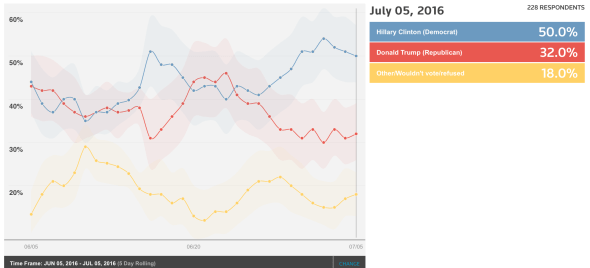
On June 5, Hillary Clinton was leading Donald Trump in Reuters Polling, 40.9 percent to 30.9 percent — a margin of 10 percentage points.
On July 5, Clinton led the presumptive Republican nominee by 40.2 percent to 30.0 percent — a margin of 10.2 percentage points.
Both candidates declined a little over the month. Trump slipped a bit more than his Democratic rival. In some ways, the minuscule decline is good news for Trump. He had a horrendous month in “free media”: Jewish stars and white supremacist message boards; a quick trip to Scotland; a vice presidential search (and rescue) mission; more praise for Saddam Hussein’s murderous efficiency; and more former Reagan and Bush (41 + 43) officials endorsing Democrat Clinton. The controversies dinged Trump temporarily, but each time he seemed to bounce back to his core support, 10 points behind Clinton’s core.
Clinton also weathered a media storm over her email server and the final report of the Republican Benghazi committee. But the clouds over her candidacy are hindering her from pulling away from the most unpopular Republican presidential candidate since the invention of scientific polling.
Amid the two candidates’ troubles, the number of undecided voters — already higher than at comparable times in recent election cycles — continued to grow. These are the people who tell Reuters they support another candidate, favor “none of the above,” plan to stay home on Election Day, or refuse to answer the question. This “other” category ticked up from 28.2 percent to 29.8 percent — within the poll’s margin of error, but still the only number that has gone up since early June.
To get from 30 percent to 50 percent, Trump has to win about two-thirds of these up-for-grabs voters. So let’s look at our 34 “battleground” voting groups and see which of these blocs has the most undecided voters. You can decide for yourself if Trump is likely to win two-thirds of them.
Battleground groups with highest share in the “other” column:
- Mormon women 54% (Clinton leads by 4 points*)
- Latinos earning $100,000 a year and more 39% (Clinton leads by 41 points)
- Midwestern white women 39% (Trump leads by 7)
- Lean conservative 38% (Clinton leads by 4 points)
- Great Lakes states voters 35% (Clinton leads by 6 points)
- All women 33.7% (Clinton leads by 7 points)
- White men under age 30 32% (Clinton leads by 4 points)
- Midwestern voters 31.8% (Clinton leads by 6.5 points)
- White voters under 40 31.1% (Clinton leads by 24.9 points)
- Single whites (never married) 30.9% (Clinton leads by 19)
Analysis: Mormon women can’t decide between two unpalatable choices. Trump has the support of only 10 percent of America’s wealthiest Latinos, but 39 percent still are not committed to either major-party candidate. Midwestern voters are the most volatile, with Midwestern women resisting Clinton but not fully embracing Trump. White men under 30 — the Bernie Sanders demographic — still have not moved to Clinton. But they haven’t gone to Trump, either.
Bottom line: More upside for Clinton among these voters, if she can close the deal. Trump can do very little to win many of these voters. They are there for Clinton to win or lose.
Now here are the battleground groups with lowest share in the “other” column:
- White Catholic men 13% (Clinton leads by 13 points)
- Whites earning between $75K and $100K 18% (Clinton leads by 18 points)
- Southern white men with college degree 20% (Clinton leads by 2 points)
- All men 20.7% (Clinton leads by 8.9 points)
- Voters earning $75K+ 22.2% (Clinton leads by 20.4 points)
Analysis: Men are more likely to have made up their minds already. And Clinton is doing surprisingly well among some unlikely blocs including Southern white men with college degrees and white Catholic men. If she were doing as well among white Catholic women as among men, she would have clinched the battleground states of the industrial heartland. Trump has lost upper-middle-class voters of all races and genders, and he’s losing college-educated voters, even in the South.
Bottom line: Most swing voters who’ve made up their minds have chosen Clinton.
While the overall “horserace” numbers haven’t changed in the past month, some of my 100 key demographic subgroups have shown movement. Here are some examples:

Trump has cratered among white voters under the age of 40. But 31.1 percent of them are in the “other” category.

While young whites despise Trump, white Baby Boomers are keeping Trump in the race with a double-digit edge over Clinton.
Clinton has opened up a big lead among upper-middle-class whites, voters with family incomes of between $75,000 and $100,000.

Trump has pulled ahead among divorced white people.
Previous posts:
>>>A look at 100 key demographic blocs, and how Trump and Clinton are faring among them
Methodology:
The Index analyzes the 2016 presidential election through the voting preferences of 100 different demographic blocs. Thirty-three of them are part of Donald Trump’s Republican base. Thirty-three of them are part of Hillary Clinton’s Democratic base. And 34 of them are battleground groups — keys to both candidates’ paths to the White House.
The information for the feature comes from Reuters’ polling data, which is available, open source, on the internet. I am using Reuters’ rolling five-day averages for most of my analysis. I chose Reuters’ numbers because the poll is respected, but, most of all, because the global news service makes the information available to anyone. You can check behind me to examine my methodology — or to create new searches of your own.
One small asterisk (*): Certain subgroups are too small to have a statistically significant counts on the five-day average. In the cases marked with an asterisk (*), I have included data for these groups from the past 30 days of polling. One warning: Subgroups are, by definition, smaller than the entire survey, so they have a larger margin of error and more volatility from survey to survey.

Recent Comments