Late demographic shifts scramble election: Trump gains among Midwestern men, wealthy Latinos; Clinton soars among unmarried white women, upper-middle-class whites
Posted: November 3, 2016 Filed under: The Index, U.S. politics | Tags: 2016 presidential race, American politics, Barack Obama, Bernie Sanders, Donald Trump, Elections, Hillary Clinton, Reuters Leave a comment![]() Is the election over yet?
Is the election over yet?
A lot has happened in the five months since Hillary Clinton and Donald Trump wrapped up their parties’ nominations after divisive primary battles. Trump has been entangled in a series of scandals of sexual, financial and prevaricatory natures. Clinton has been entangled in a series of scandals related to email servers, Russian-hacked emails and some guy named Weiner. Trump has been caught in a scandal about his foundation’s spending. Clinton has been caught in a scandal about her foundation’s fundraising.
I don’t believe in the media fiction of faux fairness through equal-opportunity faux scandal coverage. I’m just trying to make a point: A lot has happened in the general election campaign, but the relative popularity of the two candidates with the American public has changed very little. Since June 5, Trump has gained 3.3 percentage points on Chinton nationally, according to Reuters polling.

A slight Trump trend nationally, but big shifts among demographic blocs.
But within the slight national shifts to Trump, there have been significant demographic shifts that have altered the election on the ground in the 50 states. And that is what the election is about: a collection of contests for the electoral votes of 50 states, one territory (the District of Columbia) and five congressional districts in Maine and Nebraska.
Since June, I have been analyzing the partisan presidential preference of 100 demographic subgroups – 34 “battleground” groups and 33 favorable to either Democrat Clinton or Republican Trump — using polling data from Reuters. And there has been significant movement among the swing groups. Both ways. Trump has strongly improved his standing among most traditional Republican groups, like Southern whites and wealthier Latinos. Clinton has consolidated and expanded her support among almost all subgroups of women and has extended her leads among higher-income and highly educated voters, reflecting historic shifts among those once-Republican groups. On the flip side, Trump has gained significant ground among less-educated whites and white Catholics, resulting in a narrowing of Clinton’s once-daunting advantage in Pennsylvania, Wisconsin and Minnesota, and turning Ohio and Iowa into prime Trump targets.

Clinton maintains an overall edge, but Trump has made gains among some traditional Democratic blocs.
Going into the final days of the election, Clinton leads in 16 of the battleground groups I identified, Trump leads in 14, and one is tied. (Three others – veterans, families of veterans, and Mormon women – have polling sample sizes too small to analyze.)
The momentum at the end is with Trump. Trump is gaining ground with 19 of these 31 battleground groups, while Clinton has improved her standing with 10 of them. Two subgroups have not moved perceptibly over the past five months.
Among my battleground demographics, Trump has gained the most ground in the Great Plains, among Latinos earning >$100K (where he has cut a 50 point Clinton lead in half), divorced white voters, Midwestern men, white Catholics and Southern white men with college degrees. The GOP nominee’s gains among less-educated Northern white men continues a realignment that was evident in the 2012 presidential results, when Barack Obama lost ground with these voters, costing him the state of Indiana and narrowing his victory margins in Ohio, Pennsylvania, Michigan and Wisconsin.
Clinton has gained the most ground among unmarried white women, wealthy and upper-middle-class whites (white voters earning more than $150,000, whites earning between $75,000 and $100,000 a year), Midwestern white women, and white voters under the age of 40. (Bernie Sanders supporters have settled on Hillary.)
As you can see from these trends, the Midwest has become a curious electoral stew, as white men have moved strongly toward Trump while white women have shifted just as strongly toward Clinton. It underscores just how divisive the 2016 election has become.
My analysis of the Electoral College is that Clinton has a decisive edge based on the current numbers because of her continuing strength in suburban areas and among high-income and highly educated voters. That is particularly important to Clinton because these voters are concentrated in swing states that are essential for Trump to carry if he is hoping to reach the 270 Electoral Votes needed to win.
Trump’s only hope for a come-from-behind victory would be a sharp increase in his support among independent-minded voters with high incomes and college diplomas. Clinton could cement an Electoral College landslide if she gains ground among less-educated women or highly educated whites in a swath of the country stretching from North Carolina to Arizona.
Here are the “innards” of my analysis. First, you can look at which groups are the most pro-Trump or pro-Clinton. Then you can analyze the battleground groups by trendline: from those trending Trump to those trending Clinton.
I welcome your feedback on this project.

Stronger Together
Battleground voting blocs: Clinton 16, Trump 14, Tied 1
Great Plains TRUMP +28 … SWING between Clinton -39 and Clinton -20
White divorced TRUMP +17 … SWING Clinton-23
White southern women with college degree TRUMP +15 SWING Clinton-10
White Catholic women TRUMP +13 … SWING Clinton-20
Midwestern white men TRUMP +13 … SWING Clinton -22
White southerners with college degree TRUMP +12 SWING Clinton-9.9
Southern white men with college degree TRUMP +12 SWING Clinton-14
White Catholic TRUMP +11 … SWING Clinton -20
White Catholic men TRUMP +9 … SWING Clinton-22
Whites 50-65 TRUMP +8 … SWING between Clinton-4 and Clinton+5.1
Whites earning between $50-75K TRUMP +6 … SWING Clinton -7
Whites earning between $50-$100K TRUMP +3 … SWING Clinton -10.2
Married voters TRUMP +1.4 … SWING Clinton +4.5
White women, no children at home, TRUMP +0.6 … SWING Clinton -4.3
Whites earning between $75K-$100K Tie … SWING Clinton +17
Voters earning between $50K-100K CLINTON +3.6 … SWING Clinton -9.8
Lean conservative CLINTON +2 … SWING between Clinton+6 and Clinton-2
Homeowners CLINTON +2.7 … SWING Clinton-1
Men CLINTON +3.5 … SWING Clinton -10.8
White men under 30 CLINTON +3.5 … SWING Clinton -8.8
Independent CLINTON +4 … SWING Clinton+7
Midwestern white women CLINTON +5 … SWING Clinton +12
Midwest CLINTON +6.3 … SWING C-5.9 Clinton +1.6
Voters earning $75K+ CLINTON +6.7 … SWING Clinton -13.7
Women CLINTON +9.7 … SWING C-1.6 Clinton +1
Great Lakes CLINTON +16 … SWING C-2 Clinton +13
Whites earning >$150K CLINTON +18 … SWING Clinton +21.2
White single, never married CLINTON +23 … SWING Clinton +17
Whites -40 CLINTON +20.6… SWING between Clinton -4.3 and Clinton +19.4
Latinos earning >$100K CLINTON +24 … SWING Clinton -26.9
Unmarried white women CLINTON +27 … SWING Clinton +19.1

Make America Great Again (Washington Post Twitter photo)
Battleground trendline (from strongest point of each candidate to final numbers): Toward Trump 19, Toward Clinton 10, No Trend 2
Great Plains Trump +28 … SWING between Clinton -39 and Clinton -20
Latinos earning >$100K Clinton +24 … SWING Clinton -26.9
White divorced Trump +17 … SWING Clinton -23
Midwestern white men Trump+13 … SWING Clinton -22
White Catholic men Trump +9 … SWING Clinton -22
White Catholic women Trump+13 … SWING Clinton -20
White Catholic Trump +11 … SWING Clinton -20
Southern white men with college degree Trump +12 SWING Clinton-14
Voters earning $75K+ Clinton +6.7 … SWING Clinton -13.7
Men Clinton +3.5 … SWING Clinton -10.8
Whites earning between $50-$100K Trump +3.0 … SWING Clinton -10.2
White southern women with college degree Trump +15 SWING Clinton -10
White southerners with college degree Trump +12 SWING Clinton -9.9
Voters earning between $50K-100K Clinton +3.6 … SWING Clinton -9.8
White men under 30 Clinton +3.5 … SWING Clinton -8.8
Whites earning between $50-75K Trump+6 … SWING Clinton -7
White women, no children at home Trump +0.6 … SWING Clinton -4.3
Homeowners Clinton +2.7 … SWING Clinton -1
Midwest Clinton +6.3 … SWING between Clinton -5.9 and Clinton +1.6
Women Clinton +9.7 … SWING between Clinton -1.6 and Clinton +1
Whites 50-65 Trump +8 … SWING between Clinton -4 and Clinton +5.1
Lean conservative Trump+2 … SWING between Clinton+6 and Clinton -2
Married voters Trump +1.4 … SWING Clinton +4.5
Great Lakes Clinton +16 … SWING Clinton -2 and Clinton +13
Independent Clinton +4 … SWING Clinton +7
Whites -40 Clinton +20.6… SWING between Clinton -4.3 and Clinton +19.4
Midwestern white women Clinton +5 … SWING Clinton +12
White single, never married Clinton +23 … SWING Clinton +17
Whites earning between $75K-$100K Tie … SWING Clinton +17
Unmarried white women Clinton +27 … SWING Clinton +19.1
Whites earning >$150K Clinton +18 … SWING Clinton +21.2
Previous posts:
>>>A look at 100 key demographic blocs, and how Trump and Clinton are faring among them
>>> The changing South, the educational chasm and Latino backlash: 10 takeaways from a deep analysis of polling data
>>> Who are the undecided voters in 2016? Mormon women, wealthy Latinos, Midwestern white women
Methodology:
The Index analyzes the 2016 presidential election through the voting preferences of 100 different demographic blocs. Thirty-three of them are part of Donald Trump’s Republican base. Thirty-three of them are part of Hillary Clinton’s Democratic base. And 34 of them are battleground groups — keys to both candidates’ paths to the White House.
The information for the feature comes from Reuters’ polling data, which is available, open source, on the internet. I am using Reuters’ rolling five-day averages for most of my analysis. I chose Reuters’ numbers because the global news service makes the information available to anyone. You can check behind me to examine my methodology — or to create new searches of your own.
Who are the undecided voters in 2016? Mormon women, wealthy Latinos, Midwestern white women
Posted: July 7, 2016 Filed under: Dunham's Discourses, The Index, U.S. politics | Tags: 2016 presidential race, American politics, Bernie Sanders, Democratic Party, Donald Trump, Hillary Clinton, Republican Party, Undecided voters Leave a comment![]() Welcome to the third installment of The Index, a series of posts analyzing the latest polling data through the lens of 100 micro-targeted demographic groups. Today, we look at the voters who can’t make up their minds.
Welcome to the third installment of The Index, a series of posts analyzing the latest polling data through the lens of 100 micro-targeted demographic groups. Today, we look at the voters who can’t make up their minds.
The presidential campaign polling has been remarkable stable over the past month — despite temporary blips — but the number of voters who are not supporting either Hillary Clinton or Donald Trump remains historically high for the summer before a presidential election.
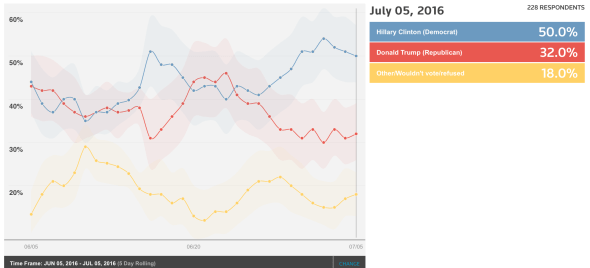
On June 5, Hillary Clinton was leading Donald Trump in Reuters Polling, 40.9 percent to 30.9 percent — a margin of 10 percentage points.
On July 5, Clinton led the presumptive Republican nominee by 40.2 percent to 30.0 percent — a margin of 10.2 percentage points.
Both candidates declined a little over the month. Trump slipped a bit more than his Democratic rival. In some ways, the minuscule decline is good news for Trump. He had a horrendous month in “free media”: Jewish stars and white supremacist message boards; a quick trip to Scotland; a vice presidential search (and rescue) mission; more praise for Saddam Hussein’s murderous efficiency; and more former Reagan and Bush (41 + 43) officials endorsing Democrat Clinton. The controversies dinged Trump temporarily, but each time he seemed to bounce back to his core support, 10 points behind Clinton’s core.
Clinton also weathered a media storm over her email server and the final report of the Republican Benghazi committee. But the clouds over her candidacy are hindering her from pulling away from the most unpopular Republican presidential candidate since the invention of scientific polling.
Amid the two candidates’ troubles, the number of undecided voters — already higher than at comparable times in recent election cycles — continued to grow. These are the people who tell Reuters they support another candidate, favor “none of the above,” plan to stay home on Election Day, or refuse to answer the question. This “other” category ticked up from 28.2 percent to 29.8 percent — within the poll’s margin of error, but still the only number that has gone up since early June.
To get from 30 percent to 50 percent, Trump has to win about two-thirds of these up-for-grabs voters. So let’s look at our 34 “battleground” voting groups and see which of these blocs has the most undecided voters. You can decide for yourself if Trump is likely to win two-thirds of them.
Battleground groups with highest share in the “other” column:
- Mormon women 54% (Clinton leads by 4 points*)
- Latinos earning $100,000 a year and more 39% (Clinton leads by 41 points)
- Midwestern white women 39% (Trump leads by 7)
- Lean conservative 38% (Clinton leads by 4 points)
- Great Lakes states voters 35% (Clinton leads by 6 points)
- All women 33.7% (Clinton leads by 7 points)
- White men under age 30 32% (Clinton leads by 4 points)
- Midwestern voters 31.8% (Clinton leads by 6.5 points)
- White voters under 40 31.1% (Clinton leads by 24.9 points)
- Single whites (never married) 30.9% (Clinton leads by 19)
Analysis: Mormon women can’t decide between two unpalatable choices. Trump has the support of only 10 percent of America’s wealthiest Latinos, but 39 percent still are not committed to either major-party candidate. Midwestern voters are the most volatile, with Midwestern women resisting Clinton but not fully embracing Trump. White men under 30 — the Bernie Sanders demographic — still have not moved to Clinton. But they haven’t gone to Trump, either.
Bottom line: More upside for Clinton among these voters, if she can close the deal. Trump can do very little to win many of these voters. They are there for Clinton to win or lose.
Now here are the battleground groups with lowest share in the “other” column:
- White Catholic men 13% (Clinton leads by 13 points)
- Whites earning between $75K and $100K 18% (Clinton leads by 18 points)
- Southern white men with college degree 20% (Clinton leads by 2 points)
- All men 20.7% (Clinton leads by 8.9 points)
- Voters earning $75K+ 22.2% (Clinton leads by 20.4 points)
Analysis: Men are more likely to have made up their minds already. And Clinton is doing surprisingly well among some unlikely blocs including Southern white men with college degrees and white Catholic men. If she were doing as well among white Catholic women as among men, she would have clinched the battleground states of the industrial heartland. Trump has lost upper-middle-class voters of all races and genders, and he’s losing college-educated voters, even in the South.
Bottom line: Most swing voters who’ve made up their minds have chosen Clinton.
While the overall “horserace” numbers haven’t changed in the past month, some of my 100 key demographic subgroups have shown movement. Here are some examples:

Trump has cratered among white voters under the age of 40. But 31.1 percent of them are in the “other” category.

While young whites despise Trump, white Baby Boomers are keeping Trump in the race with a double-digit edge over Clinton.
Clinton has opened up a big lead among upper-middle-class whites, voters with family incomes of between $75,000 and $100,000.

Trump has pulled ahead among divorced white people.
Previous posts:
>>>A look at 100 key demographic blocs, and how Trump and Clinton are faring among them
Methodology:
The Index analyzes the 2016 presidential election through the voting preferences of 100 different demographic blocs. Thirty-three of them are part of Donald Trump’s Republican base. Thirty-three of them are part of Hillary Clinton’s Democratic base. And 34 of them are battleground groups — keys to both candidates’ paths to the White House.
The information for the feature comes from Reuters’ polling data, which is available, open source, on the internet. I am using Reuters’ rolling five-day averages for most of my analysis. I chose Reuters’ numbers because the poll is respected, but, most of all, because the global news service makes the information available to anyone. You can check behind me to examine my methodology — or to create new searches of your own.
One small asterisk (*): Certain subgroups are too small to have a statistically significant counts on the five-day average. In the cases marked with an asterisk (*), I have included data for these groups from the past 30 days of polling. One warning: Subgroups are, by definition, smaller than the entire survey, so they have a larger margin of error and more volatility from survey to survey.
The changing South, the educational chasm and Latino backlash: 10 takeaways from a deep analysis of polling data
Posted: June 29, 2016 Filed under: The Index, Top Ten, U.S. politics | Tags: 2016 presidential race, American politics, Barack Obama, Democratic Party, Donald Trump, Hillary Clinton, presidential election, Republican Party, U.S. politics 2 Comments![]() Every recent national poll agrees: Hillary Clinton is leading Donald Trump as the 2016 presidential campaign enters the sizzling summer convention season.
Every recent national poll agrees: Hillary Clinton is leading Donald Trump as the 2016 presidential campaign enters the sizzling summer convention season.
But, as we all know, because of America’s antiquated Electoral College, the national “horserace” numbers don’t tell us much about what’s happening at the grassroots level, where there are 50 state-by-state contests going on. That’s one of the reasons I launched “The Index” this week. Through a deep analysis of demographic subgroups, we can get a very good idea about the way the race is shaping up in certain regions (or even states) from the ground up.
There are some important findings, and some that may surprise you, about military families, empty-nesters, young white Southerners and prosperous Latinos. I identified big shifts among Latinos, northern working-class whites, and Mormons … not always in the same direction.
>>>A look at 100 key demographic blocs, and how Trump and Clinton are faring among them
Here are ten key takeaways from my analysis of the first round of data (taken from Reuters Polling’s five-day rolling average, June 20-24):
- Education is a key defining demographic in the 2016 election. American presidential election analysis was governed by economic determinism: the higher your income, the more likely you were to vote Republican. That’s not the case this year, when the poorest and the richest are most likely to favor Hillary Clinton over Donald Trump. The divide isn’t one of income in 2016, it’s educational attainment — for white people, at least. College graduates favor Clinton by 32.2 points. That soars to a 45-point lead among Americans with advanced university degrees. Among whites without a degree, Trump leads by 14.3 points, while minority voters without college degrees favor Clinton by 41 points. Trump’s lead among less-educated whites is largest in the industrial Midwest, where millions of manufacturing jobs once filled by Americans without college diplomas have been lost over the past four decades.
- The South is changing, and the way we think about Southern politics should change. There have been far too many stories about the Republicans’ “Solid South,” which is no more solid now than the Democrats’ Dixie was in the middle of the last century. President Barack Obama won Florida and Virginia twice and North Carolina once. Because of racial, educational and generational factors, the South could become even more competitive — and very soon. Yes, Trump is strong with less-educated and older white voters, particularly southern women without college degrees (+26 points). But young white southerners are a swing voting group. White southerners with college degrees, a growing vote bloc, are nearly evenly divided, with women slightly favoring Clinton. Even with Florida’s Cuban-American’s traditional ties to the GOP, Latino voters in the Southeast are strongly Democratic in 2016 (+24 points). With the growth of the Hispanic vote in Florida, Virginia, North Carolina and Georgia, the trend lines in all of these states are likely to move toward Democrats unless Latinos or young voters reverse course. States with smaller minority populations (Arkansas, Tennessee, Kentucky, West Virginia) will remain out of reach for the party of Obama and Clinton. But Florida, North Carolina, Georgia and South Carolina are slowly trending Democratic as a new generation replaces the Confederate flag wavers, and whites from the North migrate to the warmer climes of the Southeast.
- America’s industrial heartland is deeply divided by race, religion and education. As strange as it sounds, Donald Trump might have a better chance to win Pennsylvania this year than Florida. The reason is the changing demographics of the American heartland states running west from Pennsylvania to Iowa. These areas have large, traditionally Democratic Catholic populations, a higher proportion of older voters, and more whites without college degrees. All of those factors play into Trump’s current strengths. He leads among midwestern men without college degrees by 26 points, among white Catholics over the age of 40 by 12 points, and among white Catholic women by 5. Shifts among these groups put the Clinton campaign in the danger zone: She leads in the Midwest by just 4.9 points and in the Great Lakes states by 3 points, well below her national polling numbers. If current trends hold, Trump might “bet the ranch” on winning historically Democratic states such as Pennsylvania, Michigan and Wisconsin, along with Democratic-leaning swing states such as Ohio and Iowa. States with lower minority populations (Pennsylvania, Iowa and Wisconsin) may be particularly attractive to Team Trump. Clinton easily beats Trump among mainstream Protestant denominations here, but older white Catholics are a tougher sell.
- The Latino vote could bury Trump. I have suspected from the day Trump announced — when he called Mexicans criminals and rapists — that he was going to do worse than the 27 percent Mitt Romney received in 2012. After all of his talk of a wall on the U.S. southern border, the electoral reality is sinking in. Trump is losing every kind of Latino voter: young, old, liberal, conservative, Mexican-American, Puerto Rican, Dominican — even Cuban-American, which hasn’t ever happened before. He’s doing worst among Latinos in the Pacific region (California, Nevada), where Clinton has a 60-point edge. Say goodbye to Nevada, Donald. He’s 49 points behind among Latinos in the Southwest (Arizona, New Mexico, Texas) — more than twice the deficit GOP presidential candidates have faced in the past two decades. That takes New Mexico off the table for Trump and puts Arizona into play. Even in the Southeast, with a large bloc of Cuban-Americans in Florida, Trump is down by 24 points. Unless he improves his standing, that’ll make Florida all but impossible for him to win, it’ll complicate his efforts to hold the swing state of North Carolina, and it could even help put Georgia into play. How badly is Trump doing among Hispanic Americans? Latinos earning more than $100,000 per year — a swing voter bloc — now favor Clinton by 24 points. For Latinos, Trump may have done in 2016 what “America First” anti-Semites did for Jewish voters in the 1930s and Barry Goldwater did for African Americans in 1964: unite a voting bloc of disparate national origins and varying political philosophies. If this shift is lasting, it could be profound.
- The Generation Gap is back. There is a chasm between America’s oldest (white) voters and younger voters (of all races and ethnicities). But younger voters are far more anti-Trump than older voters are pro-Trump (or anti-Clinton). Whites over age 50 favor Trump by 5.9 points, while whites under the age of 40 favor Clinton by 1.2 points. The younger the voter, the more Democratic. White men under 30 give Clinton a 10-point edge. Among students of all races, Clinton tops Trump by 33 points. This is a problem for Trump in 2016. It is a problem for Republicans for a generation.
- A wide-open battle for the white middle class. Almost everyone in America claims to be a member of the “middle class.” But when you divide U.S. incomes into numerical ranges, the plurality of voters is between $50,000 and $100,000 a year. The candidate who wins most of these votes usually wins the election. Today, that candidate is Hillary Clinton, leading by 9.3 points (almost the same as her national lead). But among white voters earning $50-100K, Trump’s up by 2.7 points. The reason is his support from the lower half of the middle class, the group earning between $50K and $75K, where he leads by 5. As middle-class incomes rise, so does support for Clinton. Trump’s appeal is stronger to lower-income whites struggling with rising costs and stagnant wages. So it should be no surprise that Trump does better in areas with more lower-middle-class whites and fewer minorities.
- The new “soccer moms”? How about “the empty-nesters”? Political reporters love to humanize swing voter blocs. The soccer moms were the rage at the turn of this century. We haven’t come up with a new one yet, but for 2016, I’ll nominate “empty-nesters.” That’s mothers who don’t have any of their kids living with them. Because all minority moms are overwhelmingly Democratic, we’ll concentrate on white empty-nest moms. They are a swing group because young moms skew Democratic like all young voters. Middle-aged and older white women tend to be a bit more Republican than the entire universe of women voters. According to the late-June Reuters polling, Clinton leads among these “empty-nesters” by 2.8 points, less than her lead among all voters but better than Barack Obama did in his successful 2012 re-election race.
- Democratic dissatisfaction with Clinton and Republican concerns about Trump are canceling themselves out at this point. There have been lots of stories about conservatives angered by Donald Trump’s coarse behavior, his repeated denunciations of Bush-Cheney foreign policy, and his long-enunciated liberal beliefs on issues ranging from abortion to gay rights. There have been stories about moderate Republicans scared off by his xenophobia and racially tinged campaign rhetoric. There have been stories about Bernie Sanders supporters pledging never, ever to vote for Hillary Clinton. But the polling numbers don’t match the stories, at least at this point. Very few hard-core partisans have switched sides. Clinton leads by 68.2 points among Obama voters, and Trump leads by 67.6 points among Romney voters. Almost identical. There appears to be at least a small enthusiasm gap on the ideological extreme: Clinton leads by 59.4 points among very liberal Democrats; Trump’s lead among very conservative Republicans is “just” 45 points, with a large number parking in the undecided column.
- Military families are shifting toward Democrats. This is one trend story that has eluded the American political media. But it makes perfect sense. As more and more of the U.S. military is made up of women and minorities, the share of presidential votes won by Democrats is going up. Trump may have accelerated the shift by his unproven allegations that U.S. troops in Iraq had pocketed stolen loot after the overthrow of Saddam Hussein. Trump hasn’t helped with his repeated assertion that the U.S. military has been incompetent under Presidents Bush and Obama. The Reuters polling shows that active duty military personnel favor Clinton by 9.4 points, and the families of active duty military and veterans lean to Clinton by 9.6 percent. Trump still leads among veterans, a predominantly white group, by 5.7 percent.
- Trump indeed has a Mormon problem. Trump’s ongoing war of words with Romney, a leading Mormon politician, and his demonization of a religion (Islam) clearly contribute to his troubles with one of the most Republican voting blocs in the country. Romney beat Obama among Mormons by some 50 points. Trump’s lead, according to a month of Reuters numbers, is 13 points — and just 8 among Mormon women. This is unlikely to cause Trump to lose heavily Mormon (and very heavily Republican) Utah, but it could prove costly in nearby states with significant Mormon presences like Nevada, Arizona, Colorado and New Mexico.
These polling numbers reflect a snapshot in time, and they could change (again and again) between now and Election Day, November 8. But this kind of data analysis can help us understand what often is oversimplified in the “who’s up, who’s down” world of daily political coverage.
This analysis is part of a series that will continue through the election season.
Click here to see the data for all 100 blocs and demographic subgroups.
A look at 100 key demographic blocs, and how Trump and Clinton are faring among them
Posted: June 27, 2016 Filed under: The Index, U.S. politics | Tags: 2016 presidential race, Democratic Party, Donald Trump, Hillary Clinton, Republican Party, Reuters, U.S. politics 8 CommentsPolls, polls, polls. Every day, it seems there is a new poll. She’s up. She’s down. He’s up. He’s really down.
What does it mean?
To many media outlets, polls are cheap click bait to drive web traffic. To cable news networks, they are the score in the latest inning of an endless political baseball game. There are some smart polling analysts, but most stories about polls are politically shallow and journalistically useless.![]()
As a political reporter who has covered every presidential race since 1980, I hope I can offer you a respite from pedestrian polling analysis. Welcome to “The Index,” a new analytical feature that will run periodically through Election Day 2016. I hope I can bring you something new, different and interesting.
Here’s my angle: I will analyze the 2016 presidential election through the voting preferences of 100 different demographic blocs. Thirty-three of them are part of Donald Trump’s Republican base. Thirty-three of them are part of Hillary Clinton’s Democratic base. And 34 of them are battleground groups — keys to both candidates’ paths to the White House.
A few of the groups are the basic demographic groups you are accustomed to hearing about: Republicans and Democrats, very liberal and very conservative voters, African Americans and born-again whites. I included these as tests of the loyalty of core voting groups for each party.
But I’m also looking at some groups you don’t read much about, the kinds of groups that will tip you off about the way the election is going. Among them: Latinos making more than $100,000 a year, white men under age 30, families with active duty military or veterans, white southerners with college degrees, homeowners, moms with kids at home, Midwestern white men, white Catholic women, even Mormon women.
I’ll analyze the different support levels of Latino voters in the Southeastern United States (where Cubans have some influence in Florida), the Southwest (from Texas to Arizona), and the Pacific coast. Differing levels of support in each region could be a tipoff as to whether states like Arizona or Georgia are in play, or whether Trump has any chance in Florida or New Mexico.
In each update, I will describe which candidate is leading among each group, and you can easily see how much better or worse than the national norm that is. The reason is simple: As the “horserace” changes from week to week, a key is whether a certain voting bloc is skewing more heavily toward Clinton or Trump. Clinton currently leads every recent national poll, but if the race ends up close, that variation from the norm will be important.
The information for the feature comes from Reuters’ polling data, which is available, open source, on the internet. I am using Reuters’ rolling five-day averages for most of my analysis. I chose Reuters’ numbers because the poll is respected, but, most of all, because the global news service makes the information available to anyone. You can check behind me to examine my methodology — or to create new searches of your own.
One small asterisk (*): Certain subgroups are too small to have a statistically significant counts on the five-day average. In the cases marked with an asterisk (*), I have included data for these groups from the past 30 days of polling. One warning: Subgroups are, by definition, smaller than the entire survey, so they have a larger margin of error and more volatility from survey to survey.
With no further introduction, here is the first set of data:
Overall (6/20-24)
Clinton 40.3%, Trump 31.3%
Clinton +9
Note: (C) means that Clinton leads by more than the 9 point national difference. (T) means that her lead with the group is less than her national lead.
Battleground groups
- Latinos earning >$100K Clinton +24* (C)
- White Catholic men Clinton +11 (C)
- Great Plains states Clinton+11 (C)
- Voters earning $75K+ Clinton +11.1 (C)
- White men under 30 Clinton +10 (C)
- Men Clinton +9.7 (C)
- Families with active duty military or veteran Clinton +9.6* (C)
- Active duty military Clinton +9.4* (C)
- Voters earning between $50K-100K Clinton +9.3 (C)
- Midwestern white men Clinton +9
- Women Clinton +8.7 (T)
- Whites earning >$150K Clinton +8 (T)
- Unmarried white women Clinton +7.9 (T)
- White single, never married Clinton +6 (T)
- White divorced Clinton +6 (T)
- Whites earning between $50-75K Clinton +5 (T)
- Midwest Clinton +4.9 (T)
- Great Lakes Clinton +3 (T)
- White Catholic Clinton +3 (T)
- White women, no children at home Clinton +2.8 (T)
- Whites earning between $50-$100K Clinton 2.7 (T)
- Whites under age 40 Clinton +1.2 (T)
- Homeowners Clinton +1.9 (T)
- Whites earning between $75K-$100K Clinton +1 (T)
- White southern women with college degree Clinton +0.4* (T)
- Independent Tie (T)
- Married voters Trump +1 (T)
- White southerners with college degree Trump +2.1* (T)
- Southern white men with college degree Trump +3.9* (T)
- Whites 50-65 Trump +4 (T)
- Lean conservative Trump +4 (T)
- Midwestern white women Trump +5 (T)
- White Catholic women Trump +5 (T)
- Mormon women Trump +8* (T)
Trump base
- Voted for Romney Trump +67.6 (T)
- Republicans Trump +52.4 (T)
- Very conservative voters Trump +45 (T)
- Moderately conservative whites Trump +35 (T)
- White born-again men Trump +35 (T)
- Southern white men Trump +33 (T)
- White born-again voters Trump +32.7 (T)
- White Tea Partiers Trump +30.5 (T)
- White born-again women Trump +30 (T)
- Whites who attend church at least once a week Trump +26 (T)
- Southern white women without college degree Trump +26 (T)
- Midwestern men without college degree Trump +26 (T)
- White women, children at home Trump +17 (T)
- Southern white men without college degree Trump +15 (T)
- White non-college grads Trump +14.3 (T)
- Southern white women Trump +13 (T)
- Whites 65+ Trump +13 (T)
- Mormons Trump +13* (T)
- White independents who voted for Romney Trump +13 (T)
- White Catholic over 40 Trump +12 (T)
- White married voters Trump +10.6 (T)
- Whites $100K-$150K Trump +9 (T)
- Southeast Trump +8.6 (T)
- South Trump +8.2 (T)
- Southwest Trump +7 (T)
- Whites 50+ Trump +6.9 (T)
- White voters Trump +6.4 (T)
- Veterans Trump +5.7* (T)
- White, children at home Trump +5.2 (T)
- White non-college grads earning <$50K Trump +5 (T)
- White voters earning less than $50K Trump +2.8 (T)
- Non-college grads Trump +0.1 (T)
- Rocky Mountain West Clinton +4 (T)
Clinton base
- African Americans who attend church at least once a week Clinton +71.6 (C)
- African Americans Clinton +70.6 (C)
- Voted for Obama Clinton +68.2 (C)
- Latino voters in West Clinton +60* (C)
- Very liberal voters Clinton +59.4 (C)
- Democrats Clinton +50.1 (C)
- Latino voters in Southwest Clinton +49* (C)
- Asian American voters Clinton +45 (C)
- Voters with advanced degrees Clinton +45 (C)
- Minority voters without college degrees Clinton +41 (C)
- White Catholic under 40 Clinton +35 (C)
- Students Clinton +33 (C)
- Voters with college degrees Clinton +32.2 (C)
- College graduates Clinton +32.2 (C)
- Latina voters Clinton +29.8* (C)
- LGBT voters Clinton +27 (C)
- Latino voters in Southeast Clinton +24* (C)
- Latino voters nationally Clinton +24* (C)
- Unmarried women Clinton +22.6 (C)
- White voters with college degree Clinton +21.1 (C)
- White men with college degree Clinton +21 (C)
- White women with college degree Clinton +20 (C)
- Voters who never attend religious services Clinton +19.3 (C)
- White students Clinton +19.5 (C)
- Southerners with college degree Clinton +19 (C)
- Latino men Clinton +18* (C)
- Voters under 40 Clinton +16.4 (C)
- Far West Clinton Clinton Clinton +16 (C)
- Mid-Atlantic Clinton +15 (C)
- Voters who attend religious services once a month or less Clinton +15 (C)
- New England Clinton +14 (C)
- Voters under 30 Clinton +13.9 (C)
- Women with no children at home Clinton +10.9 (C)
In the next few days, I will post some of the analytical highlights of this first data dump, explaining which subgroups’ results I think are the most important and surprising. I look forward to sharing the 2016 political roller coaster with you.


Recent Comments