The state of China’s economy in 15 charts: Growth, challenges and expanding global role

A digital representation of the globe highlighting China with interconnected lines symbolizing global connectivity and trade.

China’s economy is undergoing a profound transformation. The world’s second-largest economy remains a manufacturing powerhouse, a global trading giant and an increasingly important leader in emerging technologies. But beneath the impressive numbers lie significant challenges, including a struggling property market, weak consumer confidence, youth unemployment and simmering trade tensions.

Much of the global media coverage has tended toward the extremes: the rising economic power that will overtake the United States and end the American Century — or an over-levered, debt-fueled mess that cannot sustain the government-juiced growth of the past decade and is heading toward inevitable decline.

How can we make sense of these seemingly contradictory and overly simplistic visions?

Sometimes, the best way to understand a complicated economic story is to visualize it.

These 15 charts and infographics examine the state of China’s economy from several different perspectives. They explore the country’s changing economic structure, its expanding global trade relationships, the remarkable growth of electric vehicles and robotics, and its ambitions in artificial intelligence. They also examine the pressures facing Chinese households, workers, property owners and investors.

The graphics reveal an economy of striking contrasts: technological dynamism alongside structural weaknesses, global competitiveness alongside domestic uncertainty, and extraordinary industrial capacity amid questions about future growth.

No single statistic can adequately capture an economy as large and complex as China’s. Taken together, however, these visualizations provide a broader picture of where China stands today, how it got here and what may lie ahead.

They also demonstrate how data visualization can turn complicated economic statistics into accessible stories for an international audience. Enjoy! And please share your feedback and predictions.

Note: I used AI research to help me with find the latest data for this project. I tried to confirm all data that I used. If you see anything that is incorrect, please let me know and I will fix it.
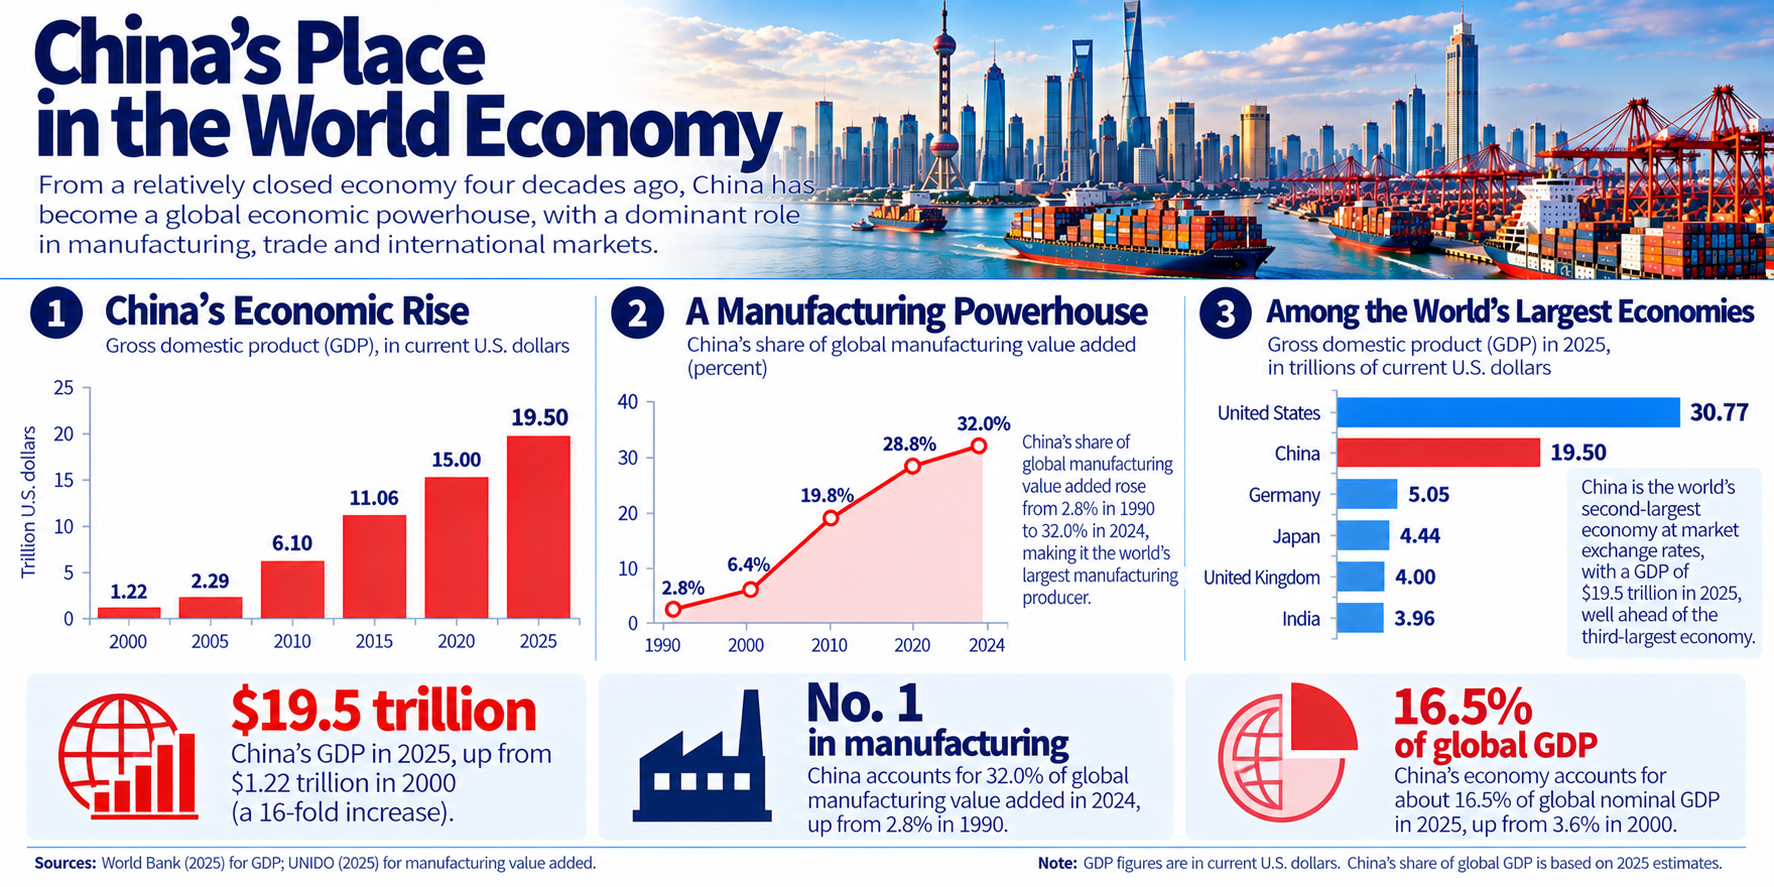
Infographic illustrating China's economic growth and position in the world economy, highlighting GDP, manufacturing dominance, and comparison with other major economies.
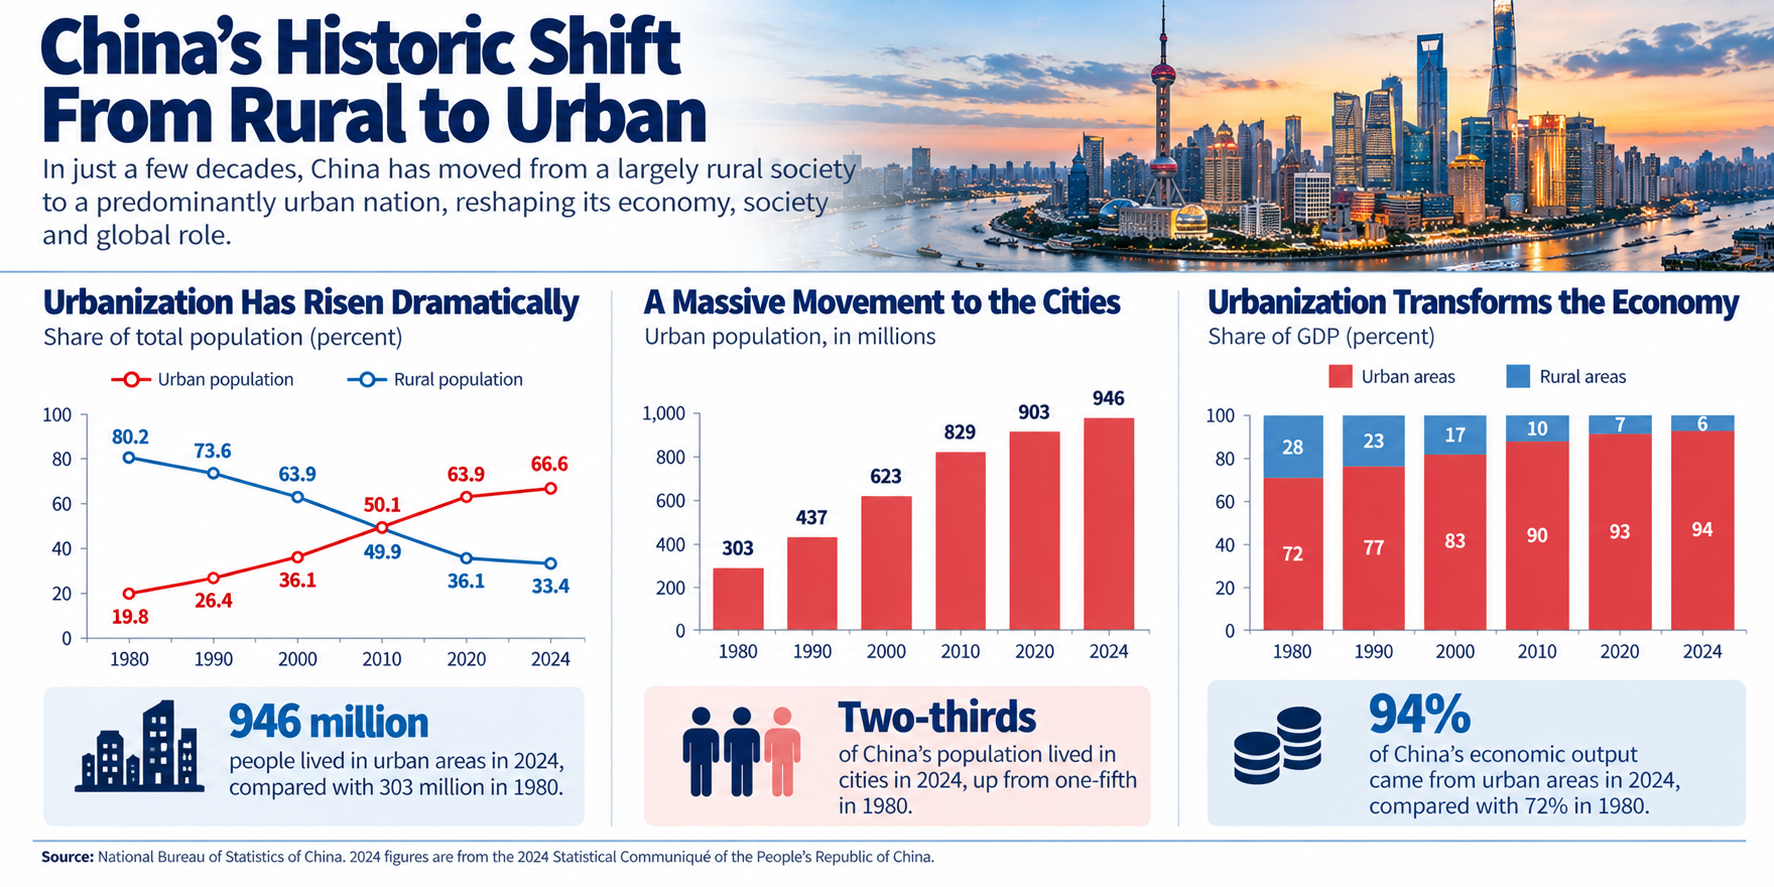
Infographic illustrating China's shift from a rural to an urban society, highlighting urbanization statistics, urban population growth, and economic impacts from 1980 to 2024.
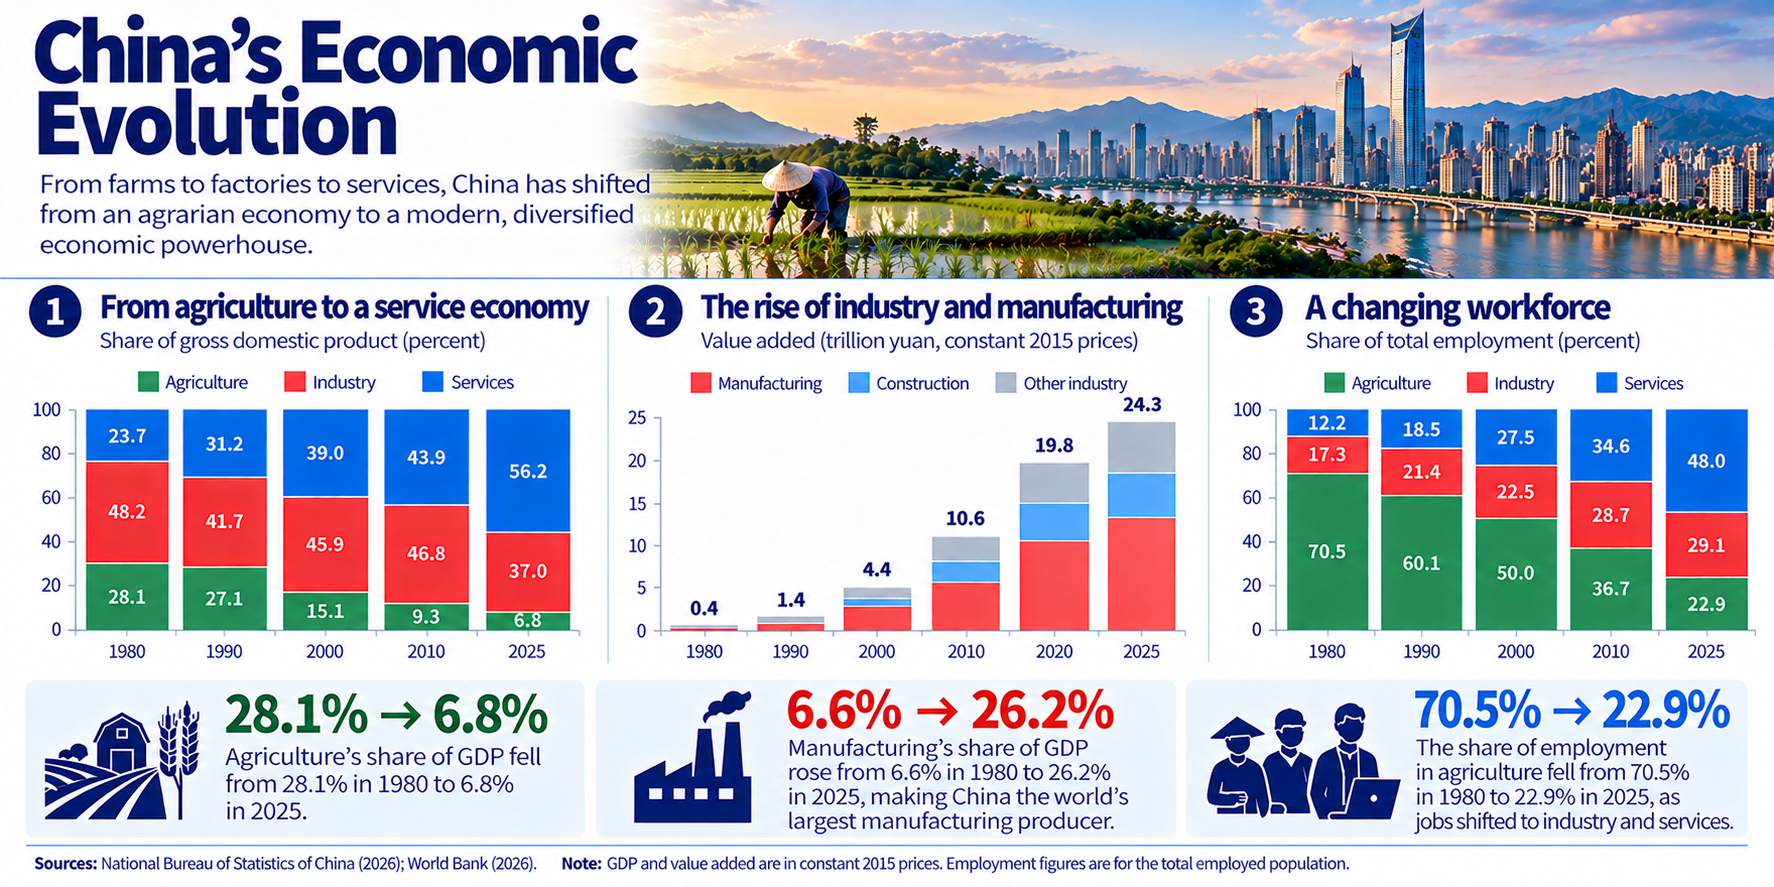
Infographic titled 'China's Economic Evolution' showcasing the shift from an agrarian economy to a diverse service-driven economy. Includes graphs on GDP share by sector: agriculture, industry, services, and employment trends from 1980 to projected 2025.
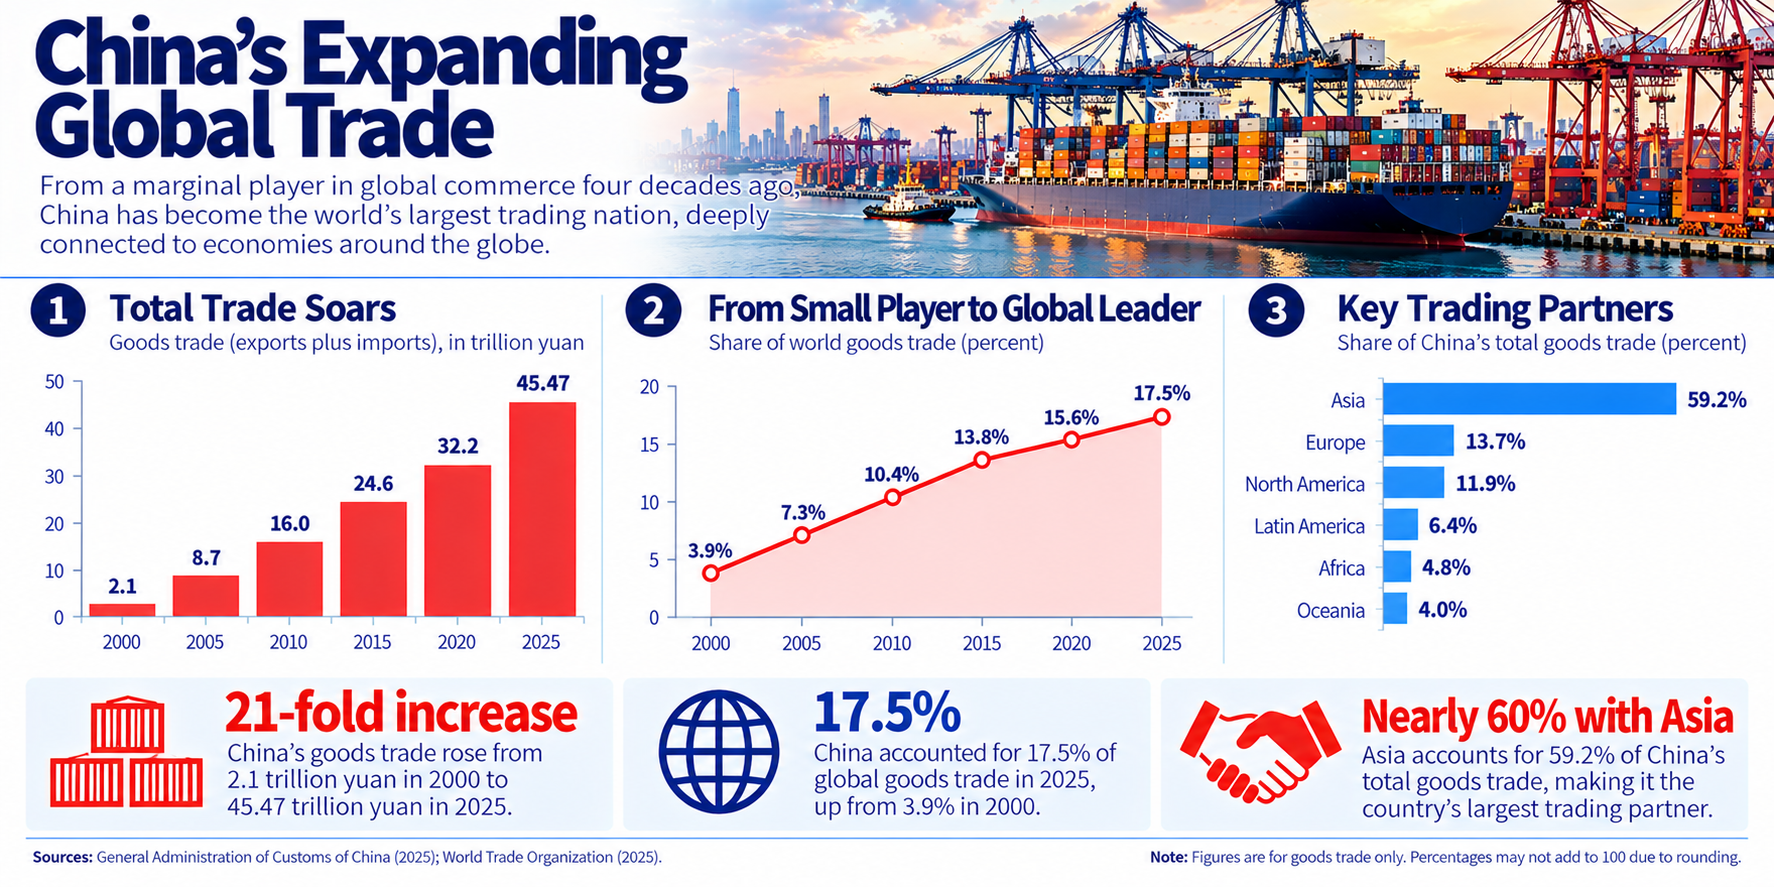
Infographic depicting China's expanding global trade with statistics on total trade volume, world goods trade share, and key trading partners. Highlights include a 21-fold increase in goods trade, a rise to 17.5% of global goods trade, and a significant focus on Asia as China's largest trading partner.
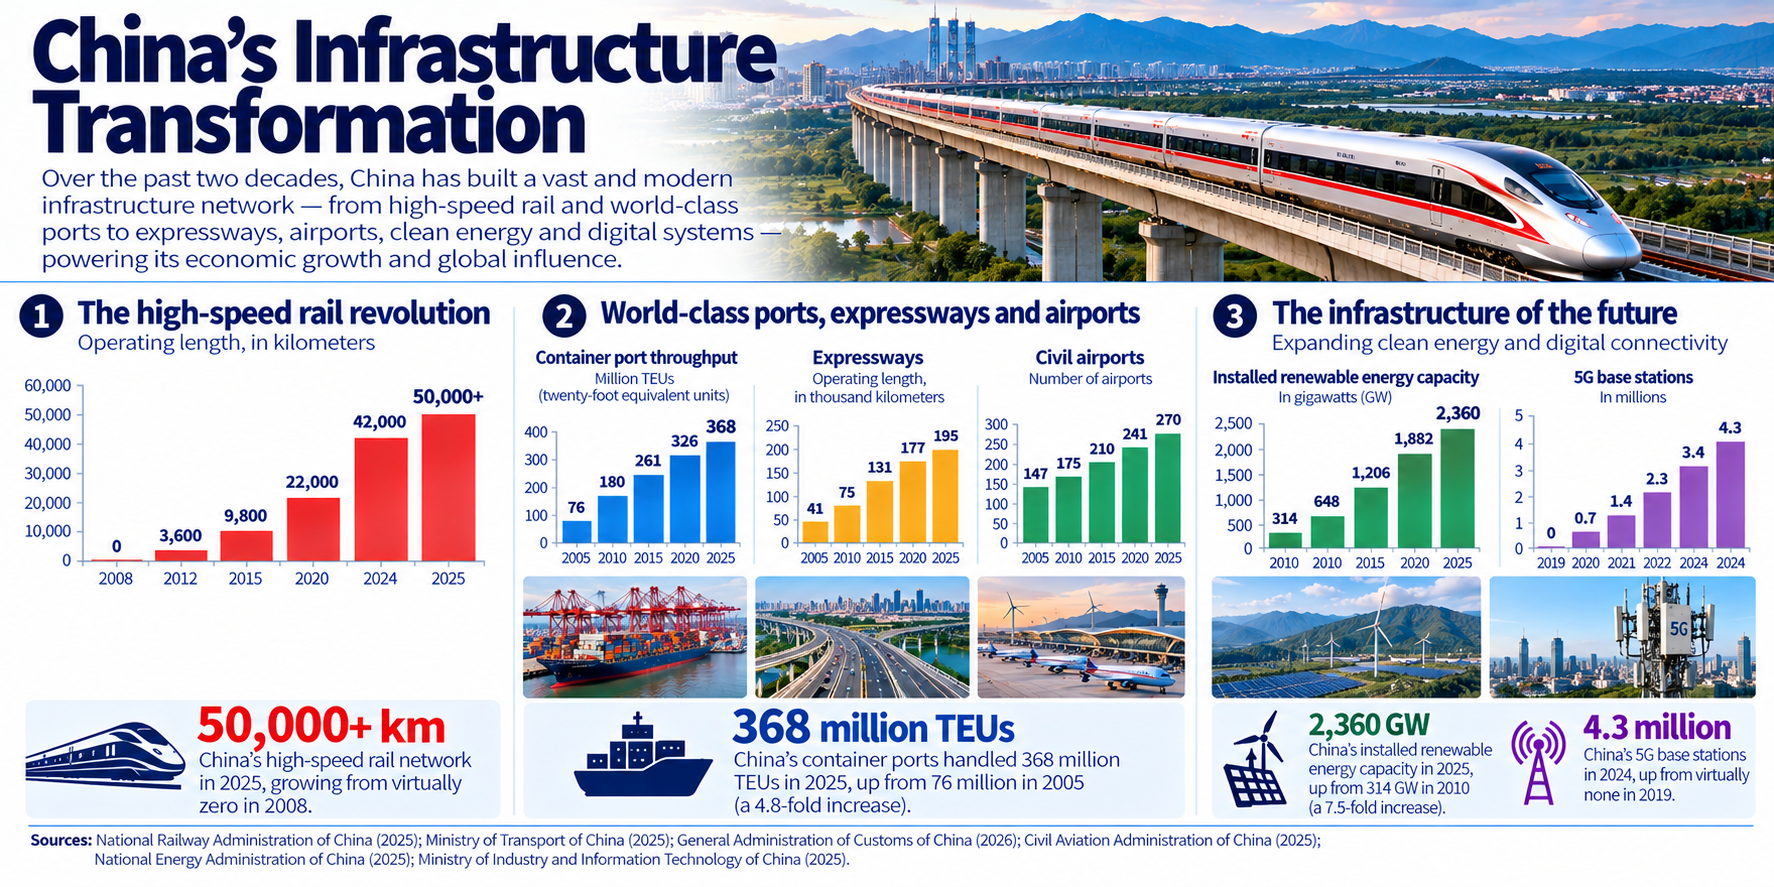
Infographic titled 'China's Infrastructure Transformation' showcasing China's high-speed rail network, world-class ports, expressways, airports, and future infrastructure developments, with statistical data and visual elements highlighting growth from 2000 to 2022.
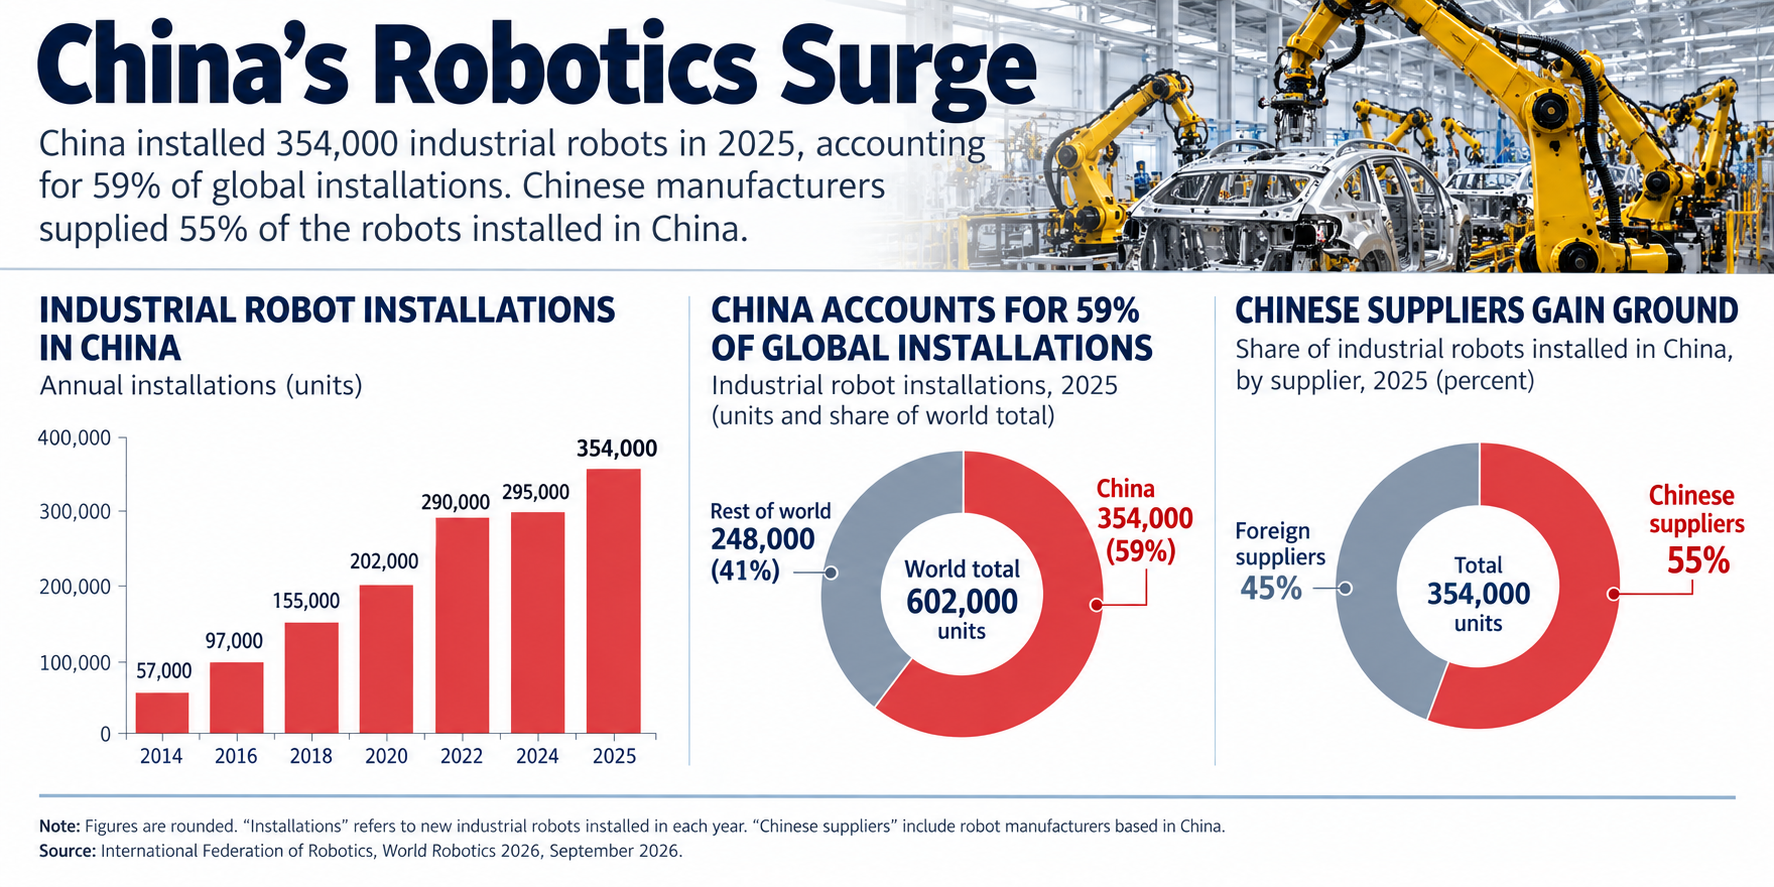
Infographic titled 'China's Robotics Surge' detailing the increase in industrial robot installations in China, with statistics for 2015 to 2025. It highlights that China installed 354,000 robots in 2025, making up 59% of global installations. Includes bar graph for annual installations, pie charts showing China's share and the role of Chinese suppliers.
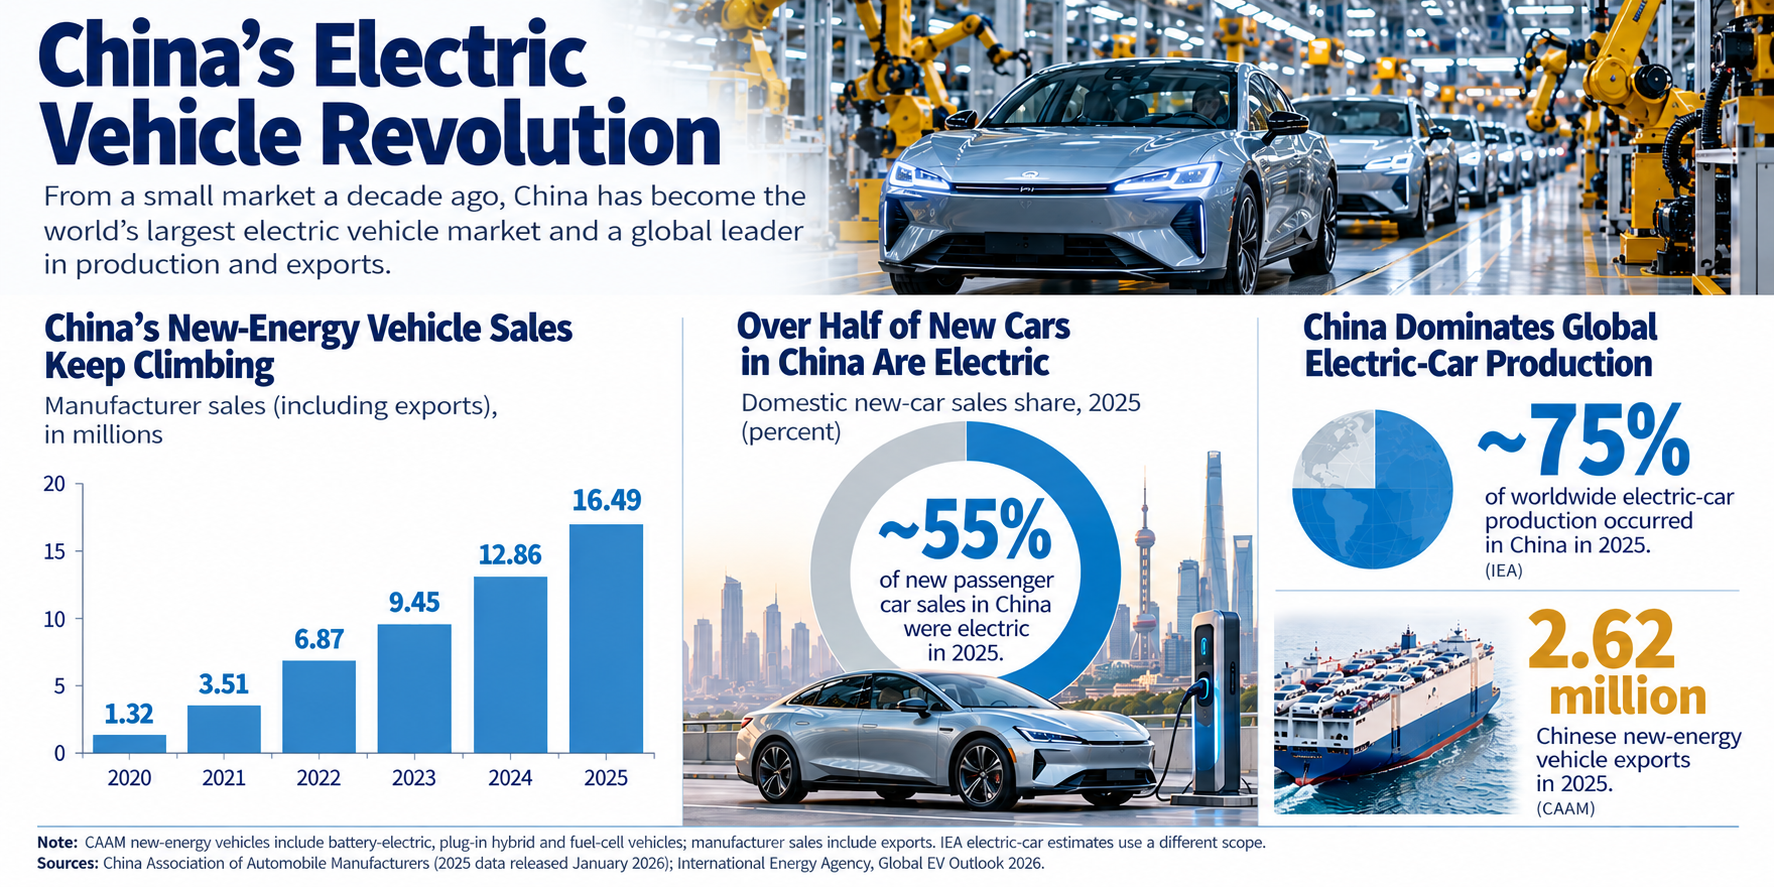
Infographic titled 'China's Electric Vehicle Revolution' featuring statistics on China's electric vehicle sales, production, and market share for new-energy vehicles from 2020 to 2025.
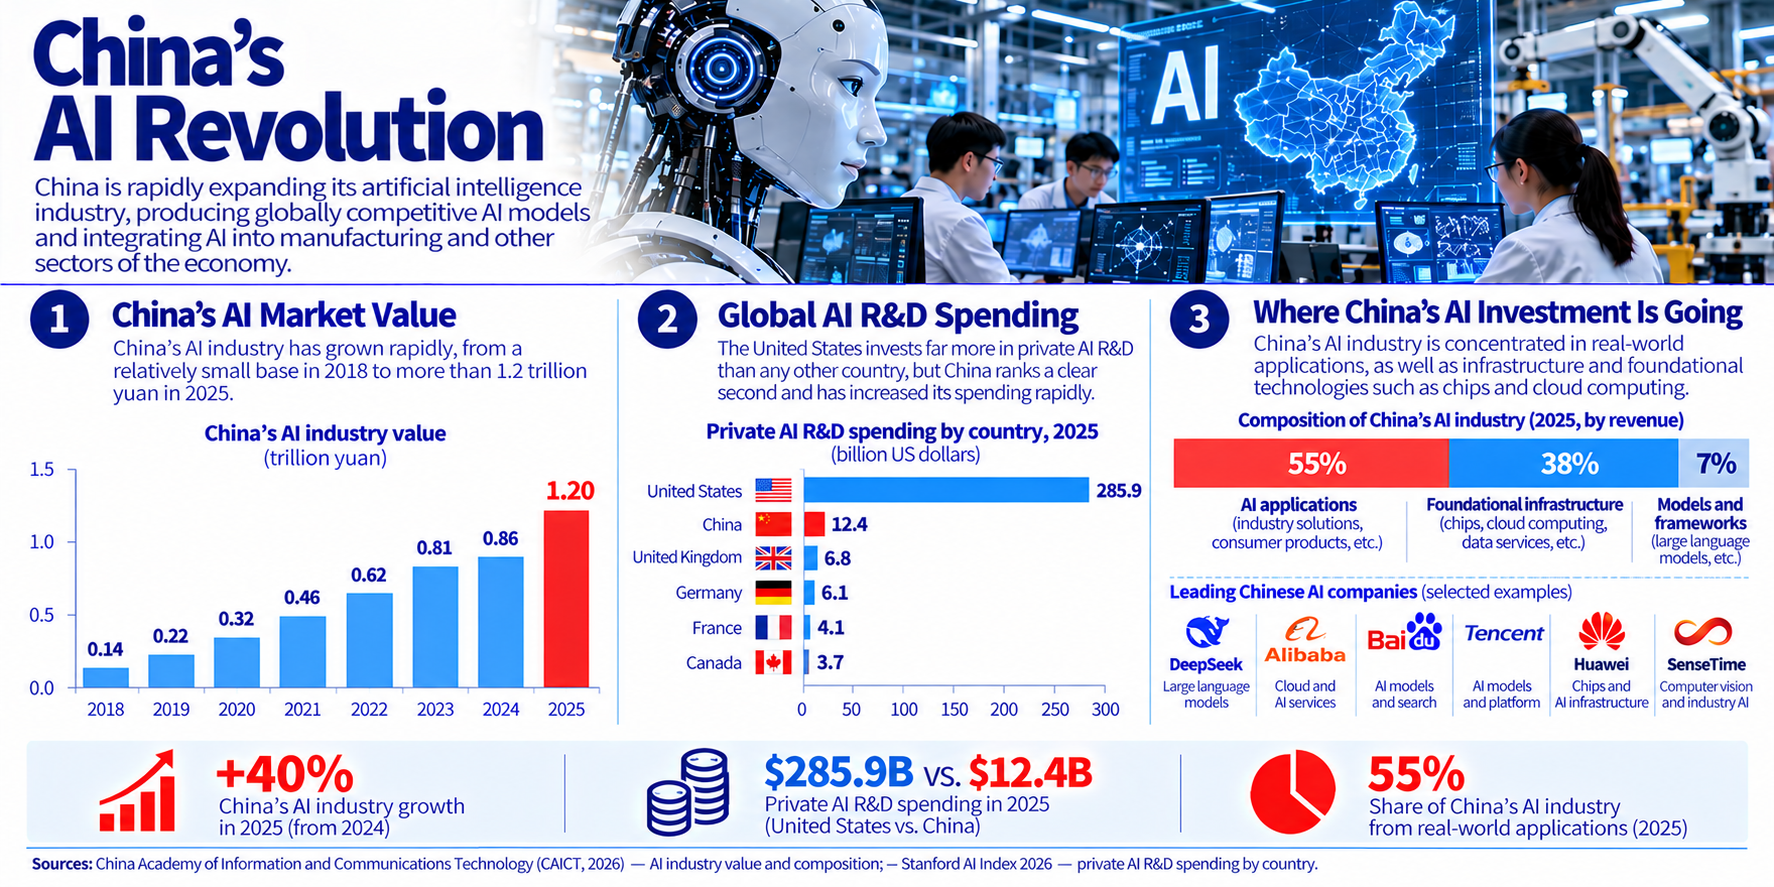
Infographic titled 'China's AI Revolution' showing the growth of China's AI industry, global R&D spending, and investment distribution in AI applications. It includes statistics and projections for market value and research funding over the years.
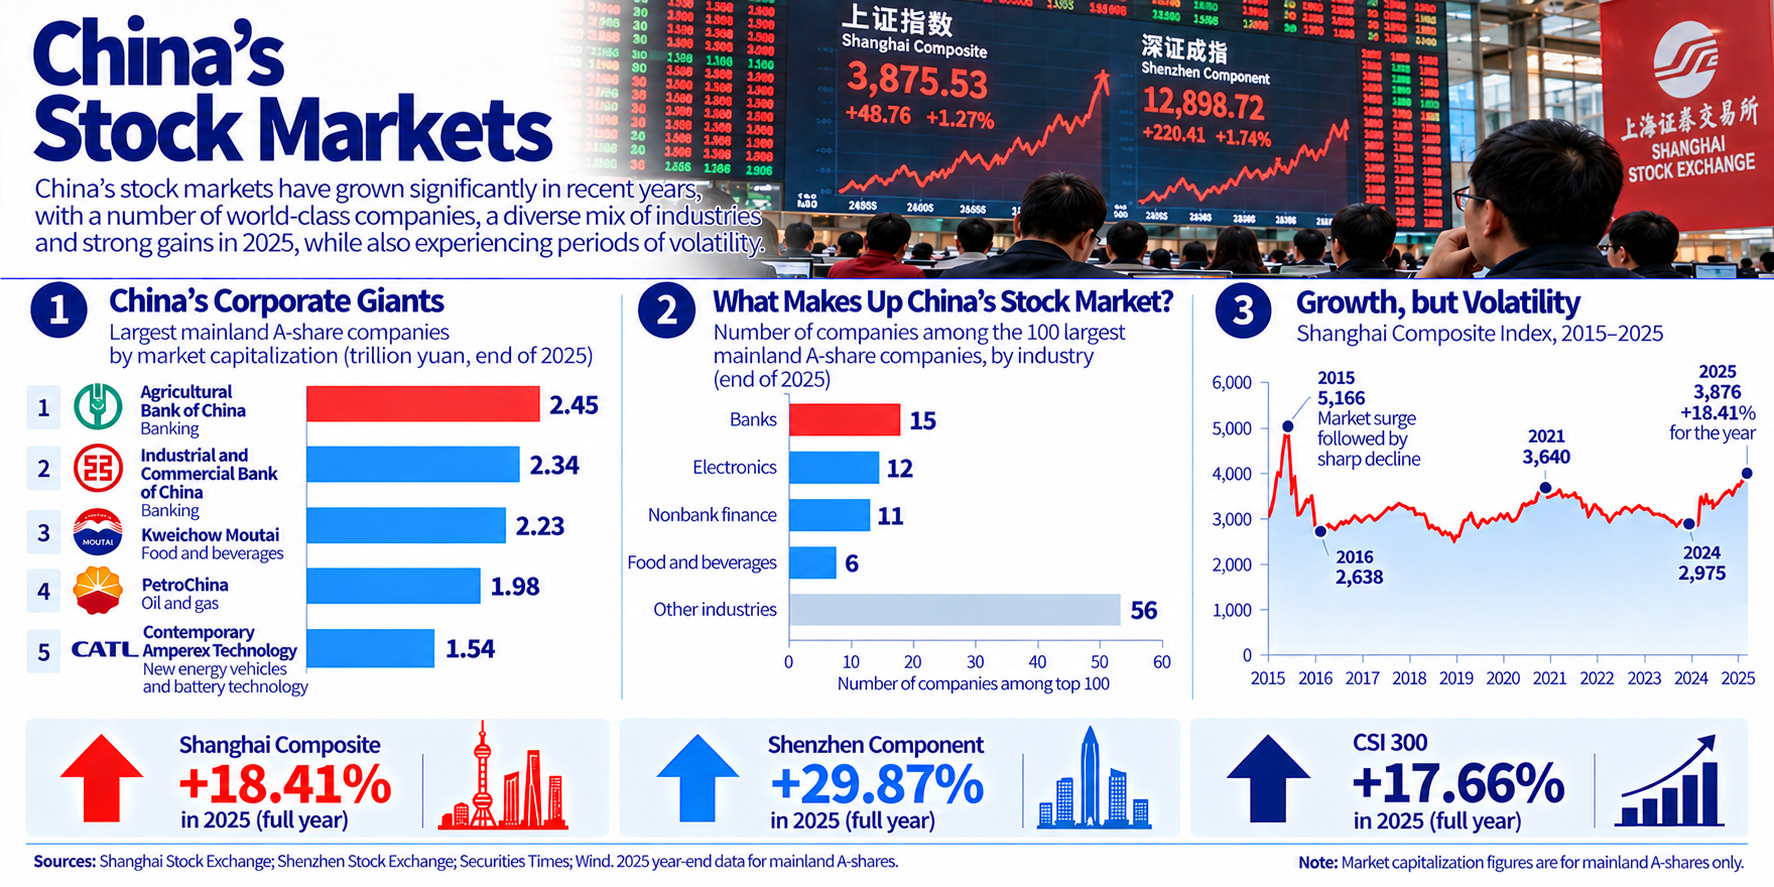
Infographic comparing China's stock markets, highlighting major corporate giants by market capitalization, industry breakdown of companies, and performance growth with volatility from 2015 to 2025.
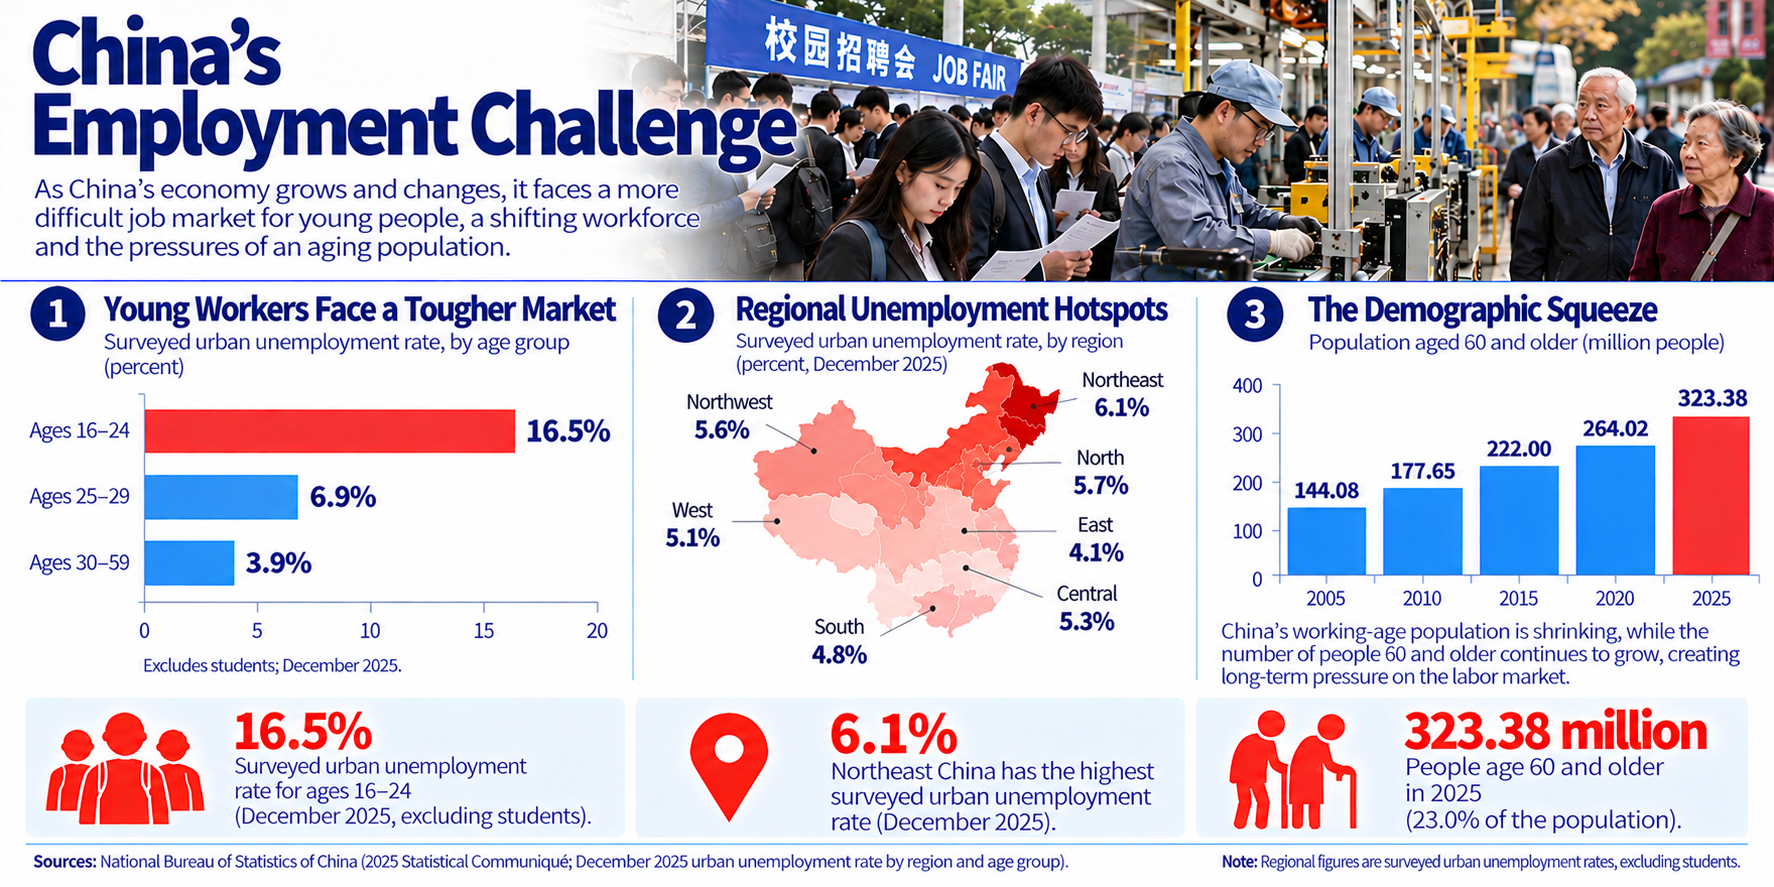
Infographic titled 'China's Employment Challenge', detailing unemployment rates among young workers, regional unemployment hotspots, and demographic trends. Features statistics for ages 16-24 and 25-29, regional unemployment rates across different areas, and future population estimates for those aged 60 and older.
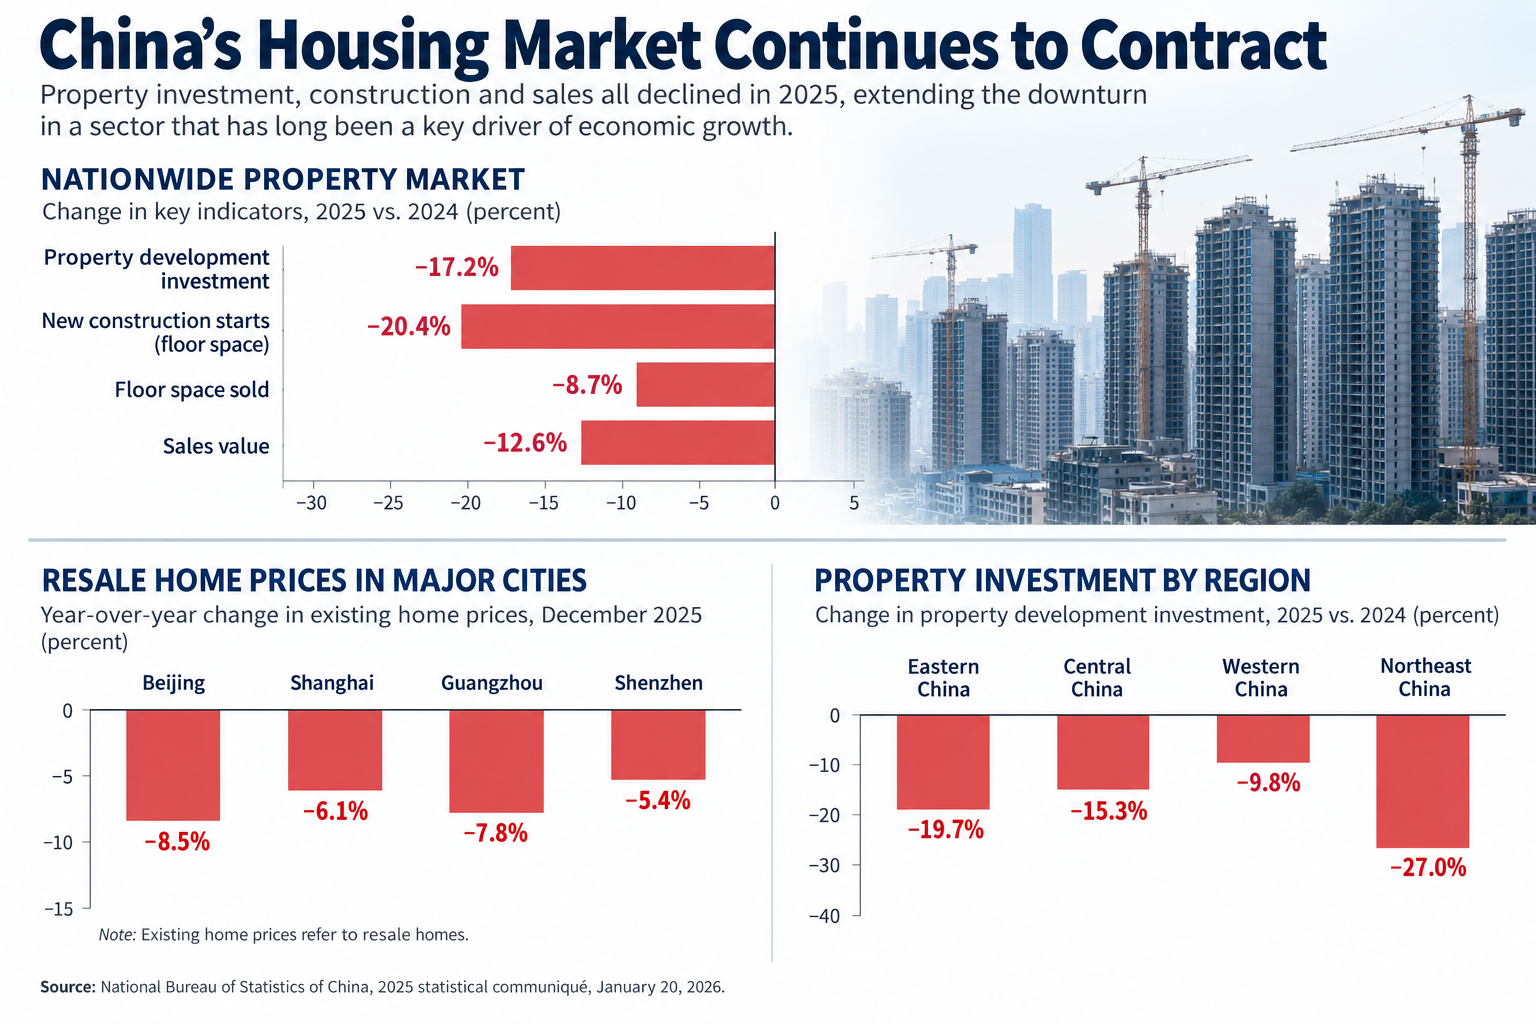
Infographic detailing China’s housing market trends, showing declines in property investment, construction, and sales for 2025 compared to 2024.
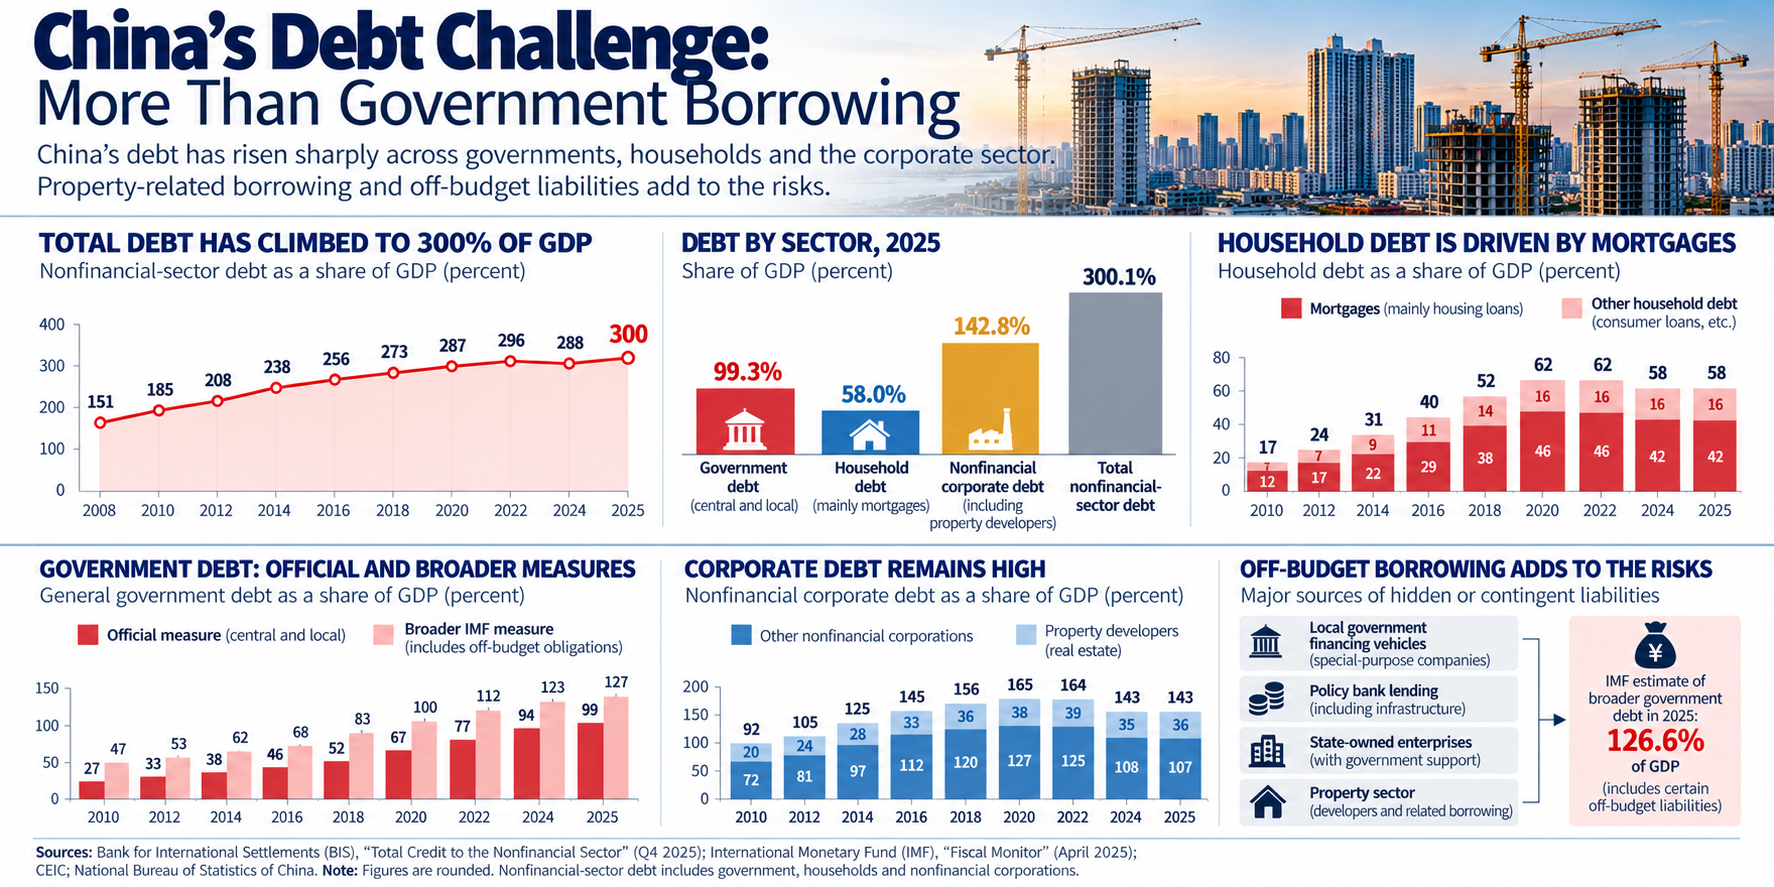
Infographic titled 'China's Debt Challenge: More Than Government Borrowing' detailing China's rising debt across various sectors. It includes graphs showing total debt as a percent of GDP, breakdown by sector for 2025, household debt driven by mortgages, government and corporate debt statistics, and the risks associated with off-budget borrowing.
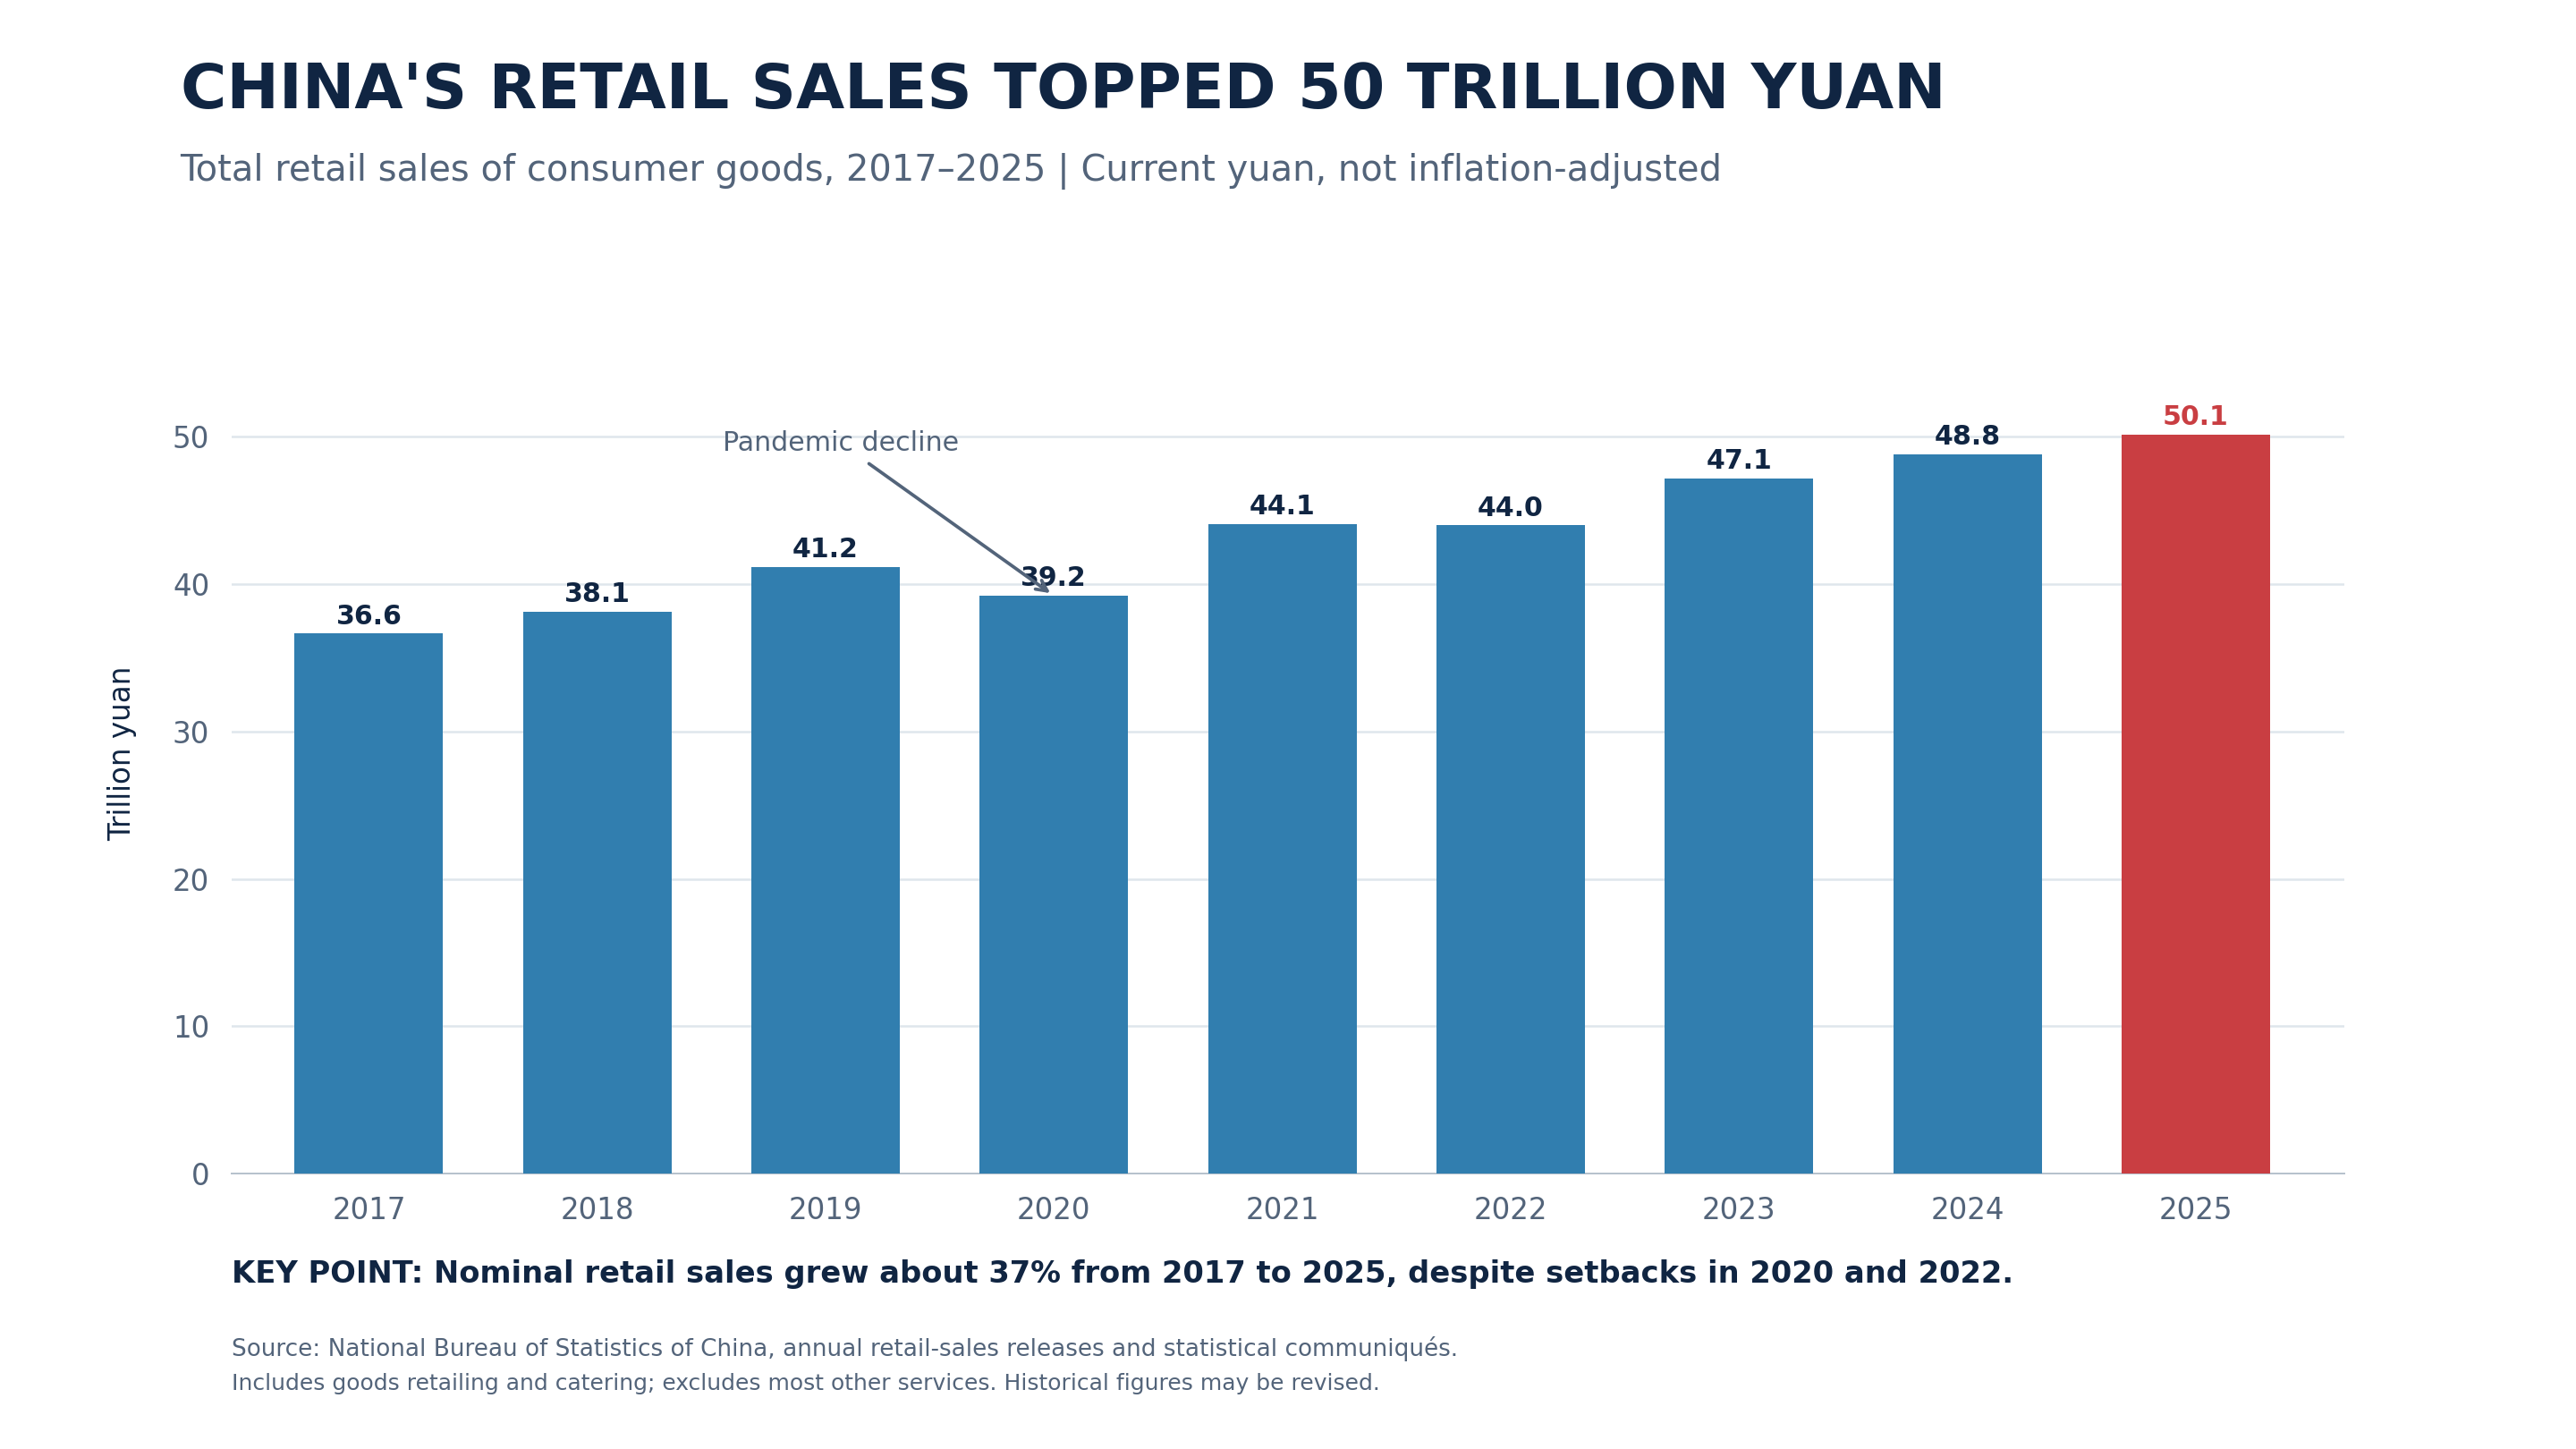
Bar graph illustrating China's retail sales from 2017 to 2025, showing a growth trend with a notable decline during the pandemic. Sales are measured in trillion yuan, with a projection of 50.1 trillion yuan in 2025.
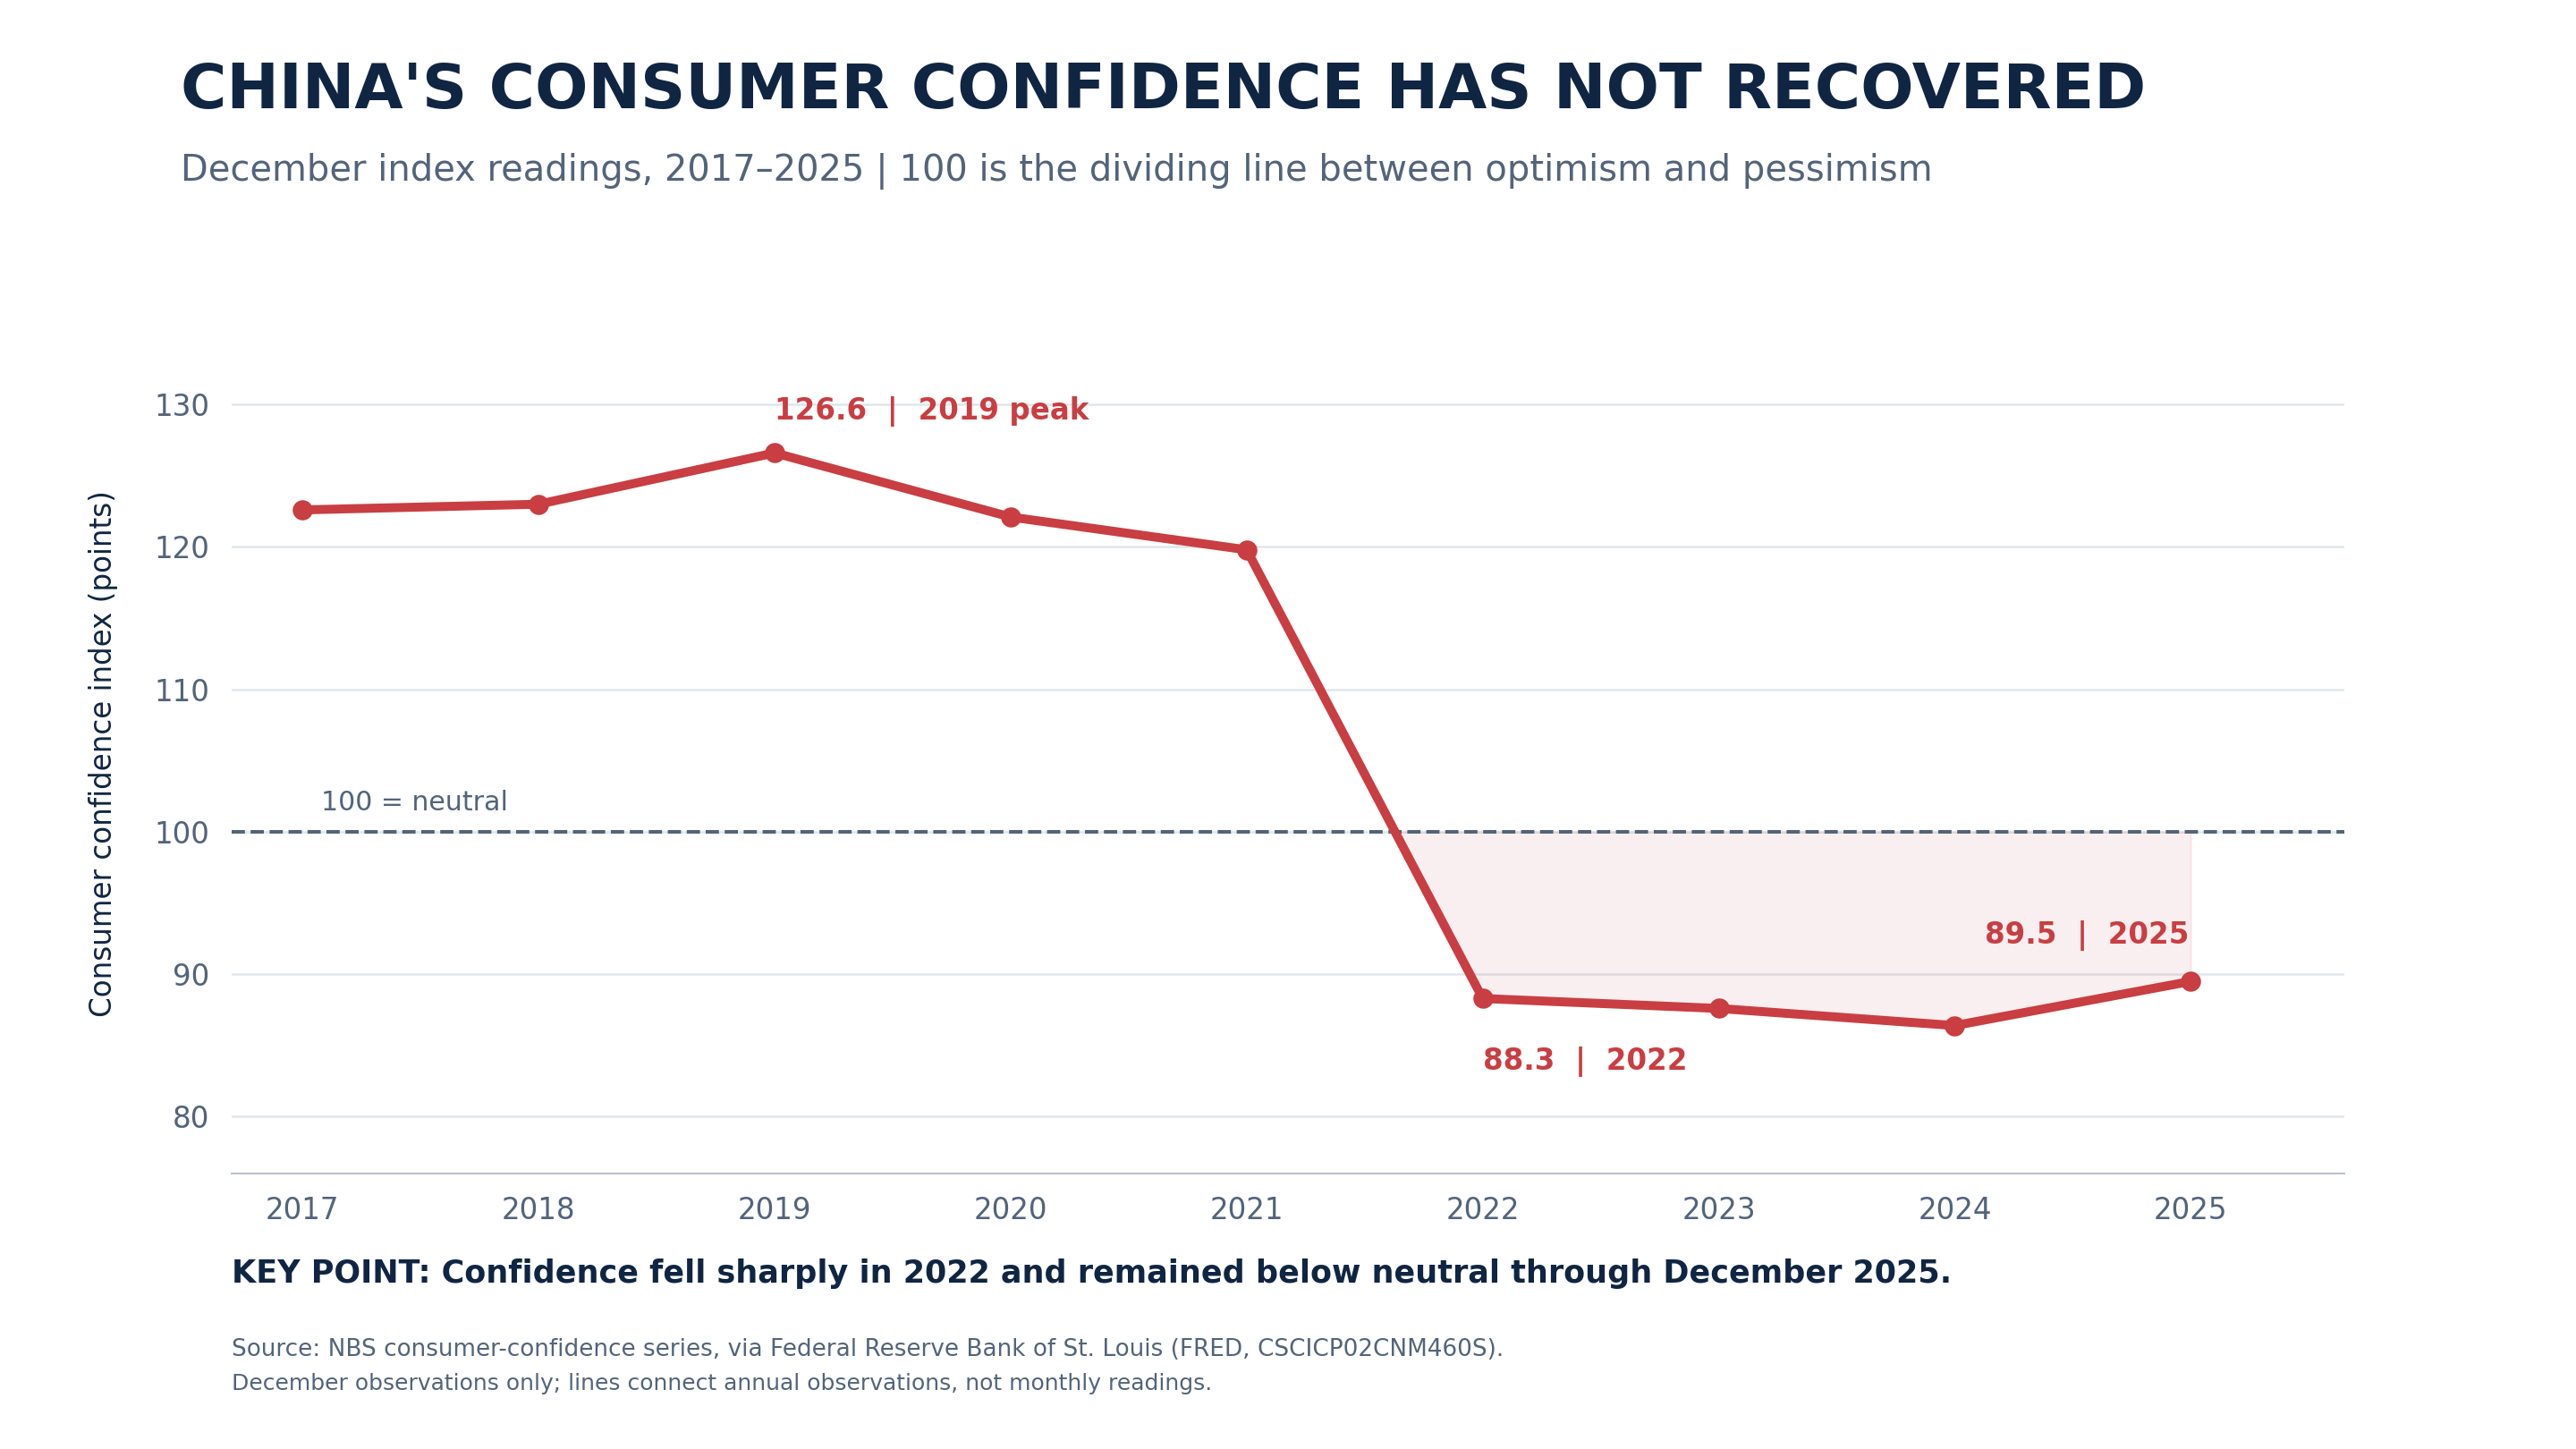
Line graph displaying China's consumer confidence index from 2017 to 2025, showing a peak of 126.6 in 2019, a sharp decline to 88.3 in 2022, and a slight increase to 89.5 projected for 2025, with 100 as the neutral line between optimism and pessimism.
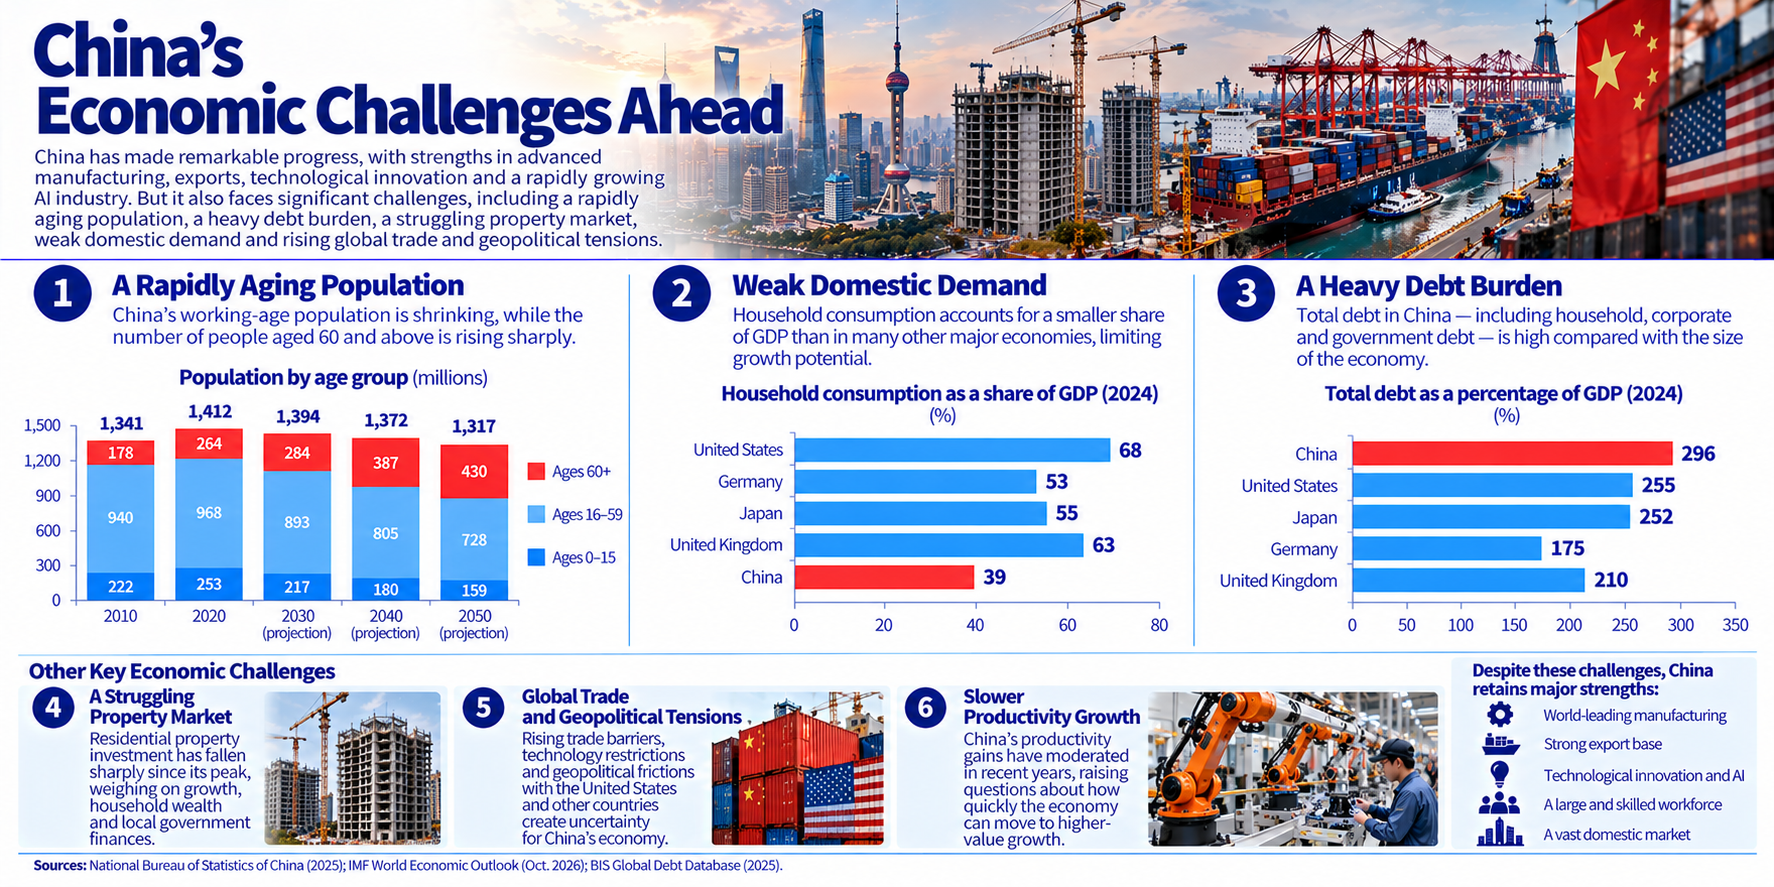
Infographic highlighting China's economic challenges, including a rapidly aging population, weak domestic demand, and a heavy debt burden. It provides statistics on population demographics, household consumption as a share of GDP, and total debt as a percentage of GDP compared to other countries.


Leave a Reply