The state of China’s economy in 15 charts: Growth, challenges and expanding global role
Posted: October 21, 2026 Filed under: AI, Discovering China | Tags: AI, Artificial Intelligence, China, Chinese economy, consumer confidence, debt, economy, global economy, history, housing, infrastructure, international economics, international trade, news, politics, retail sales, robotics, stock market, unemployment Leave a comment
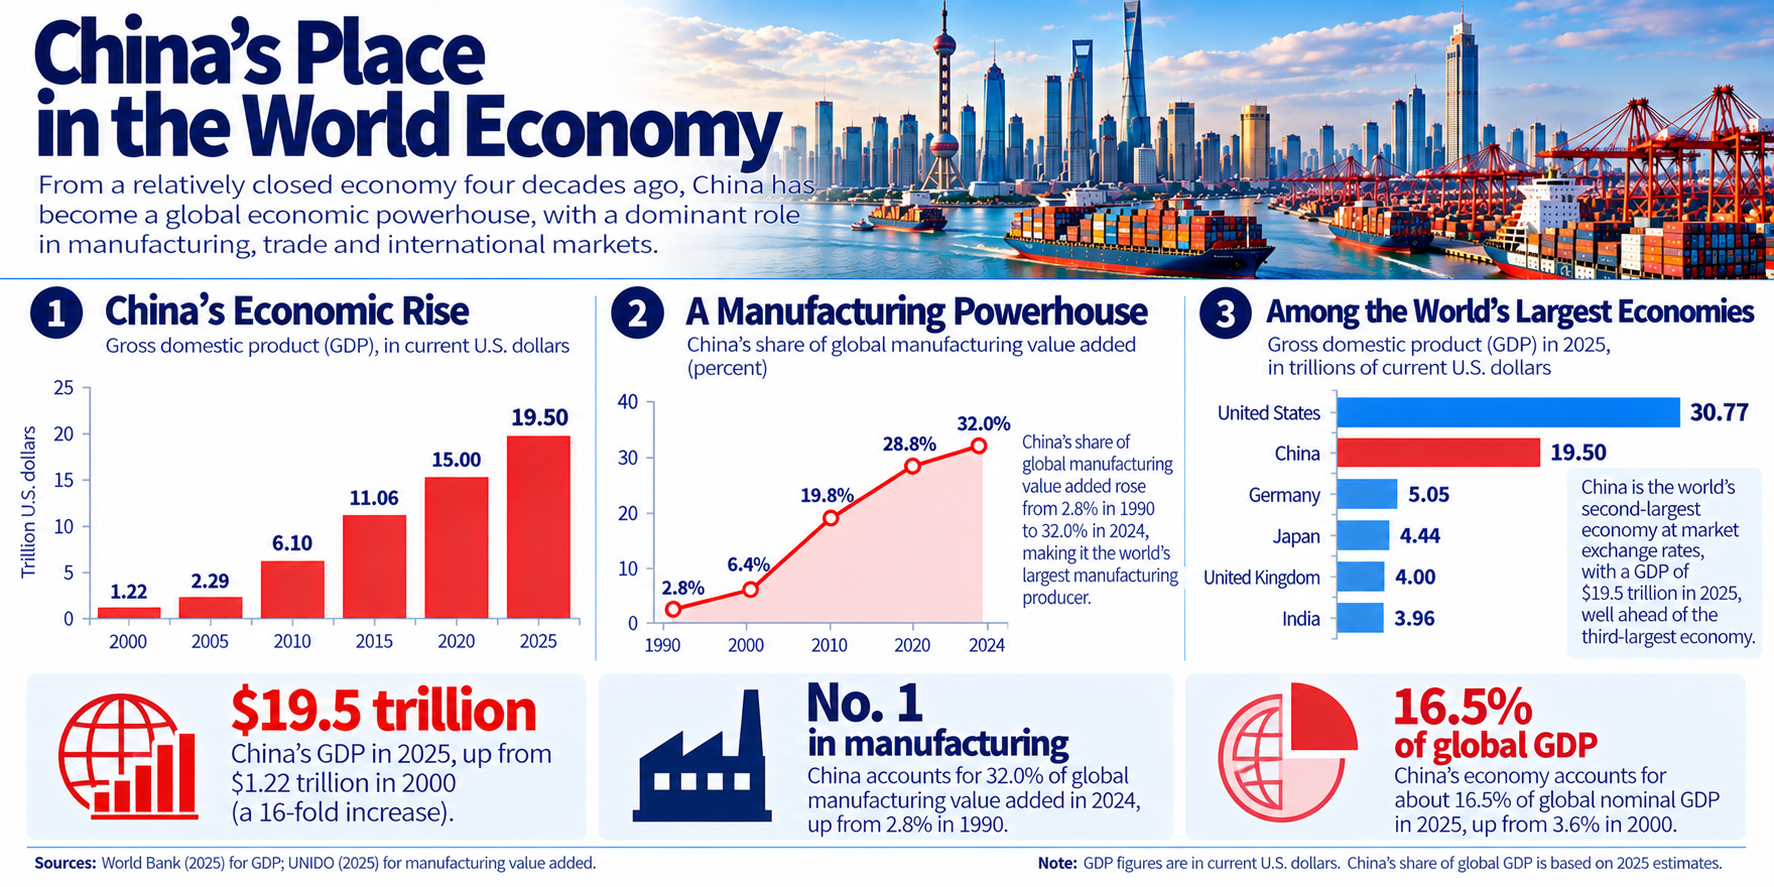
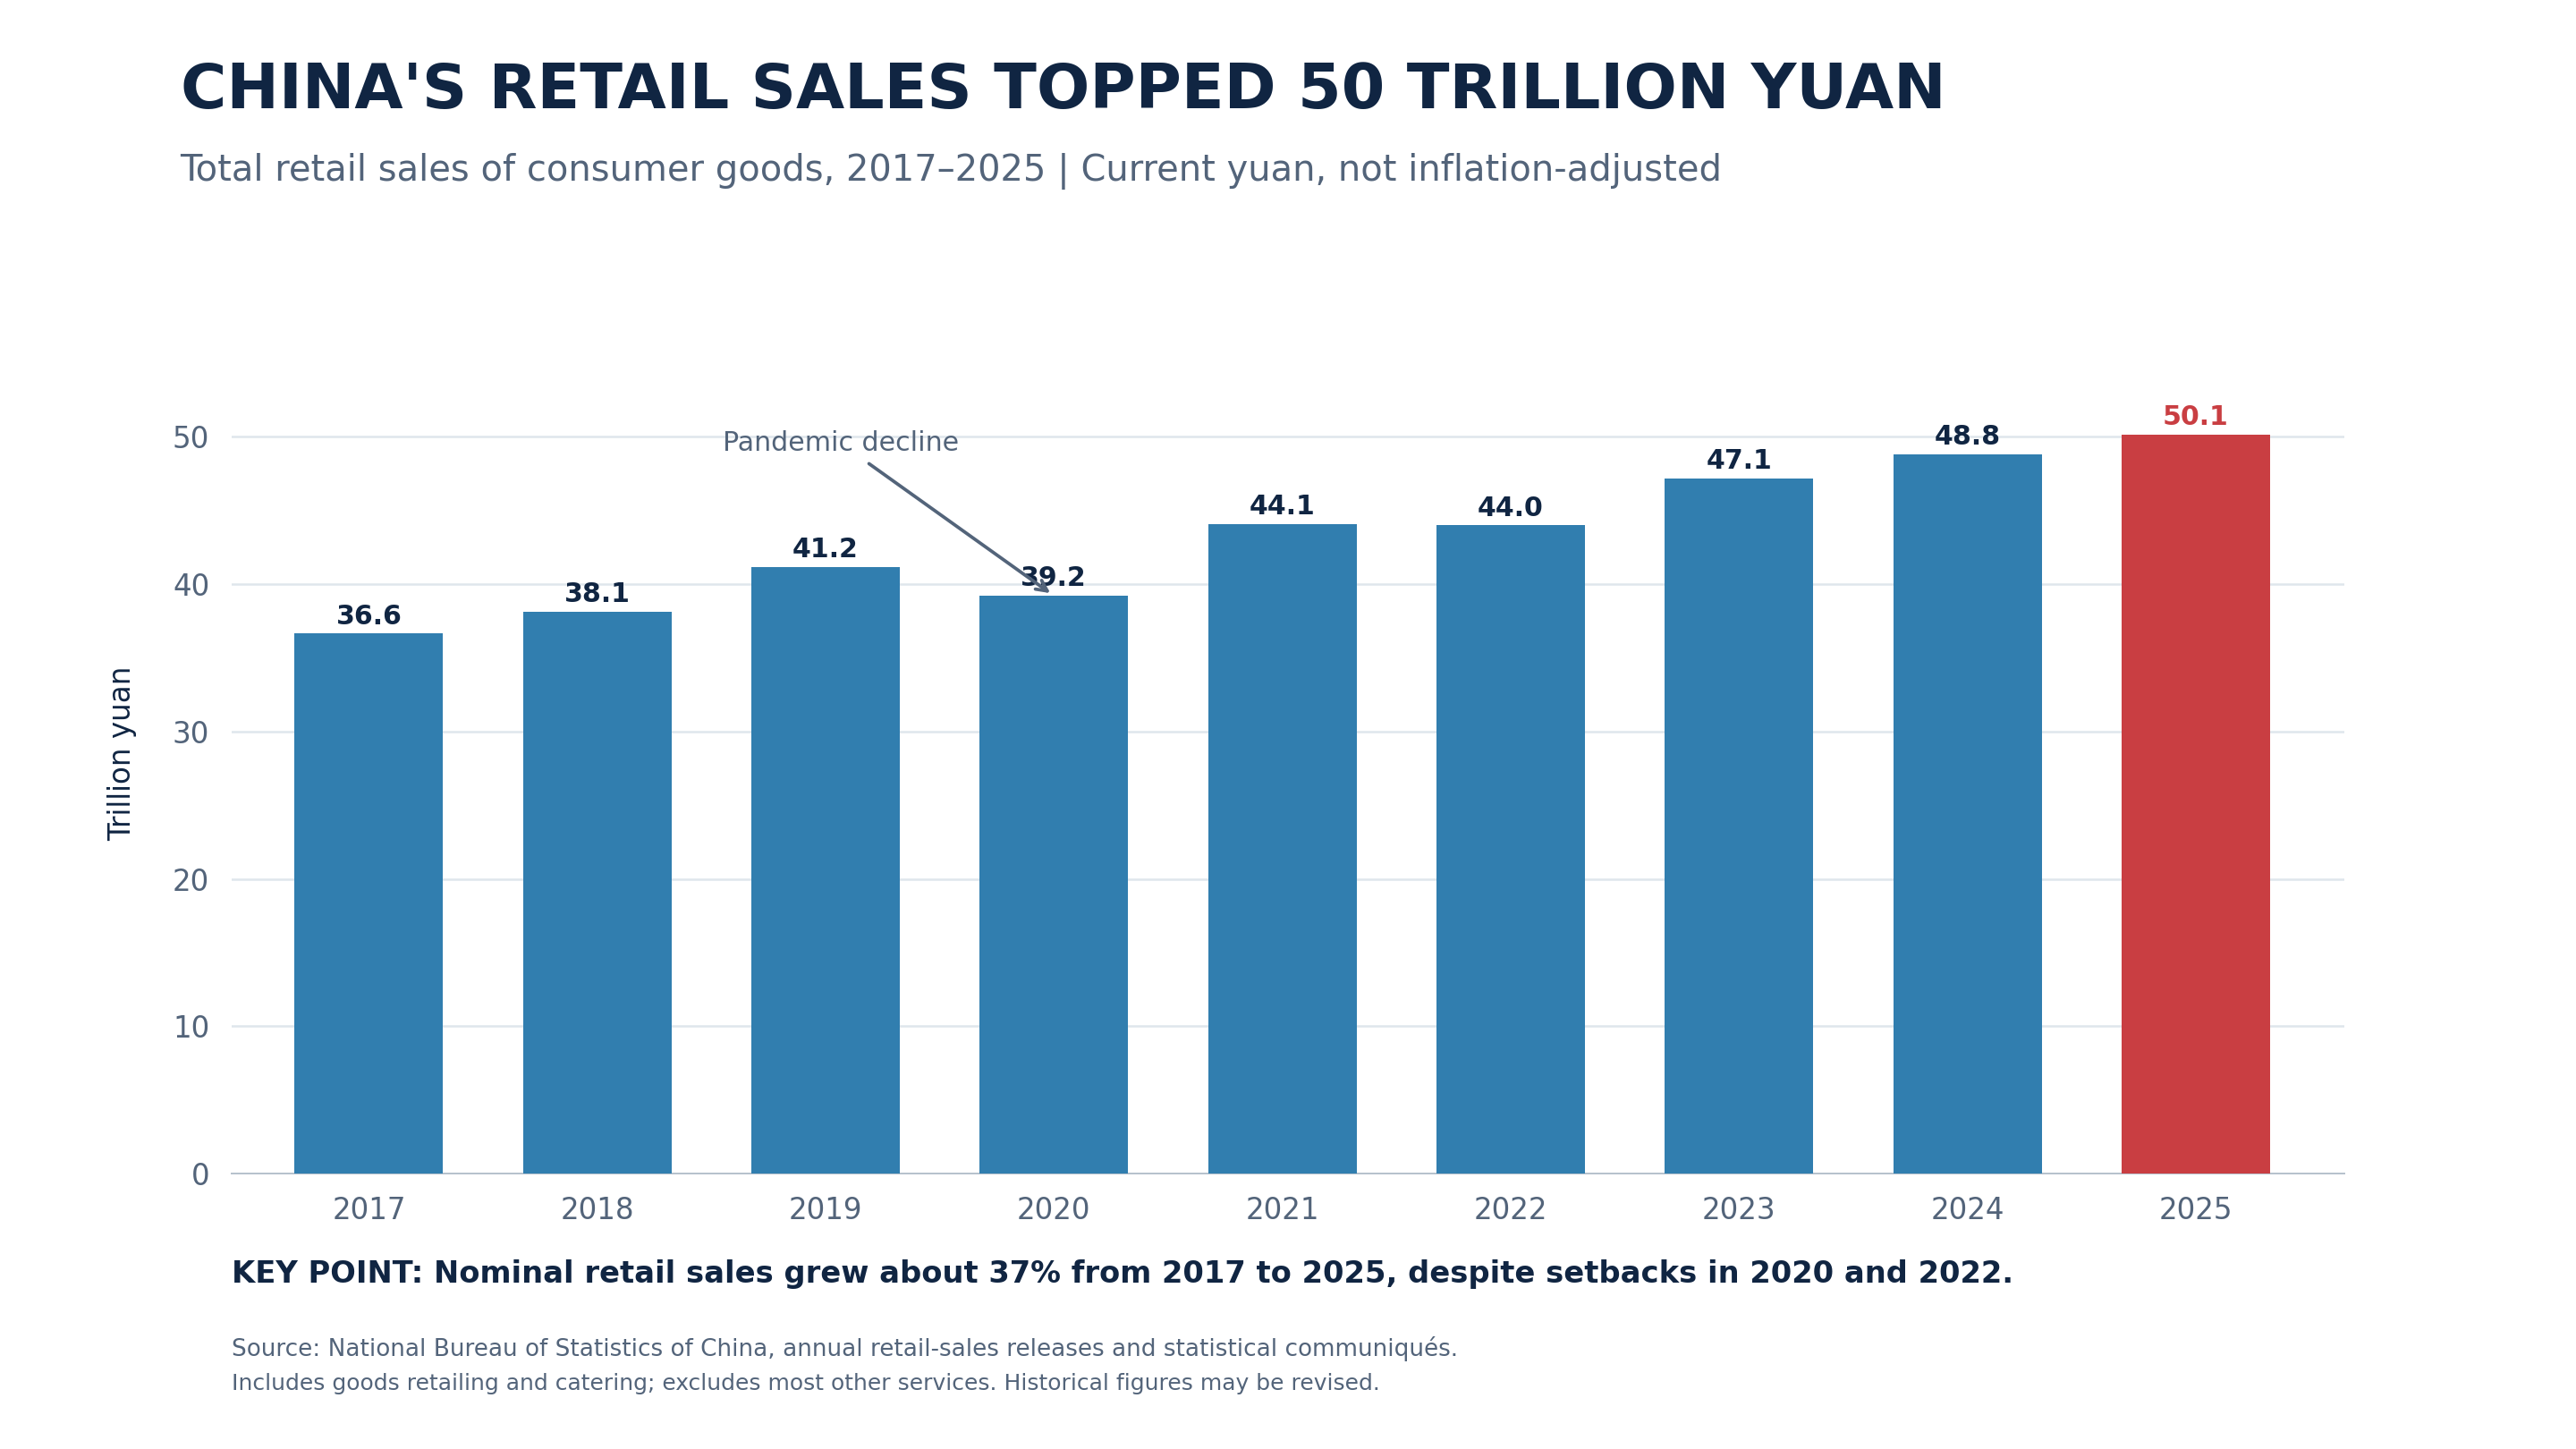
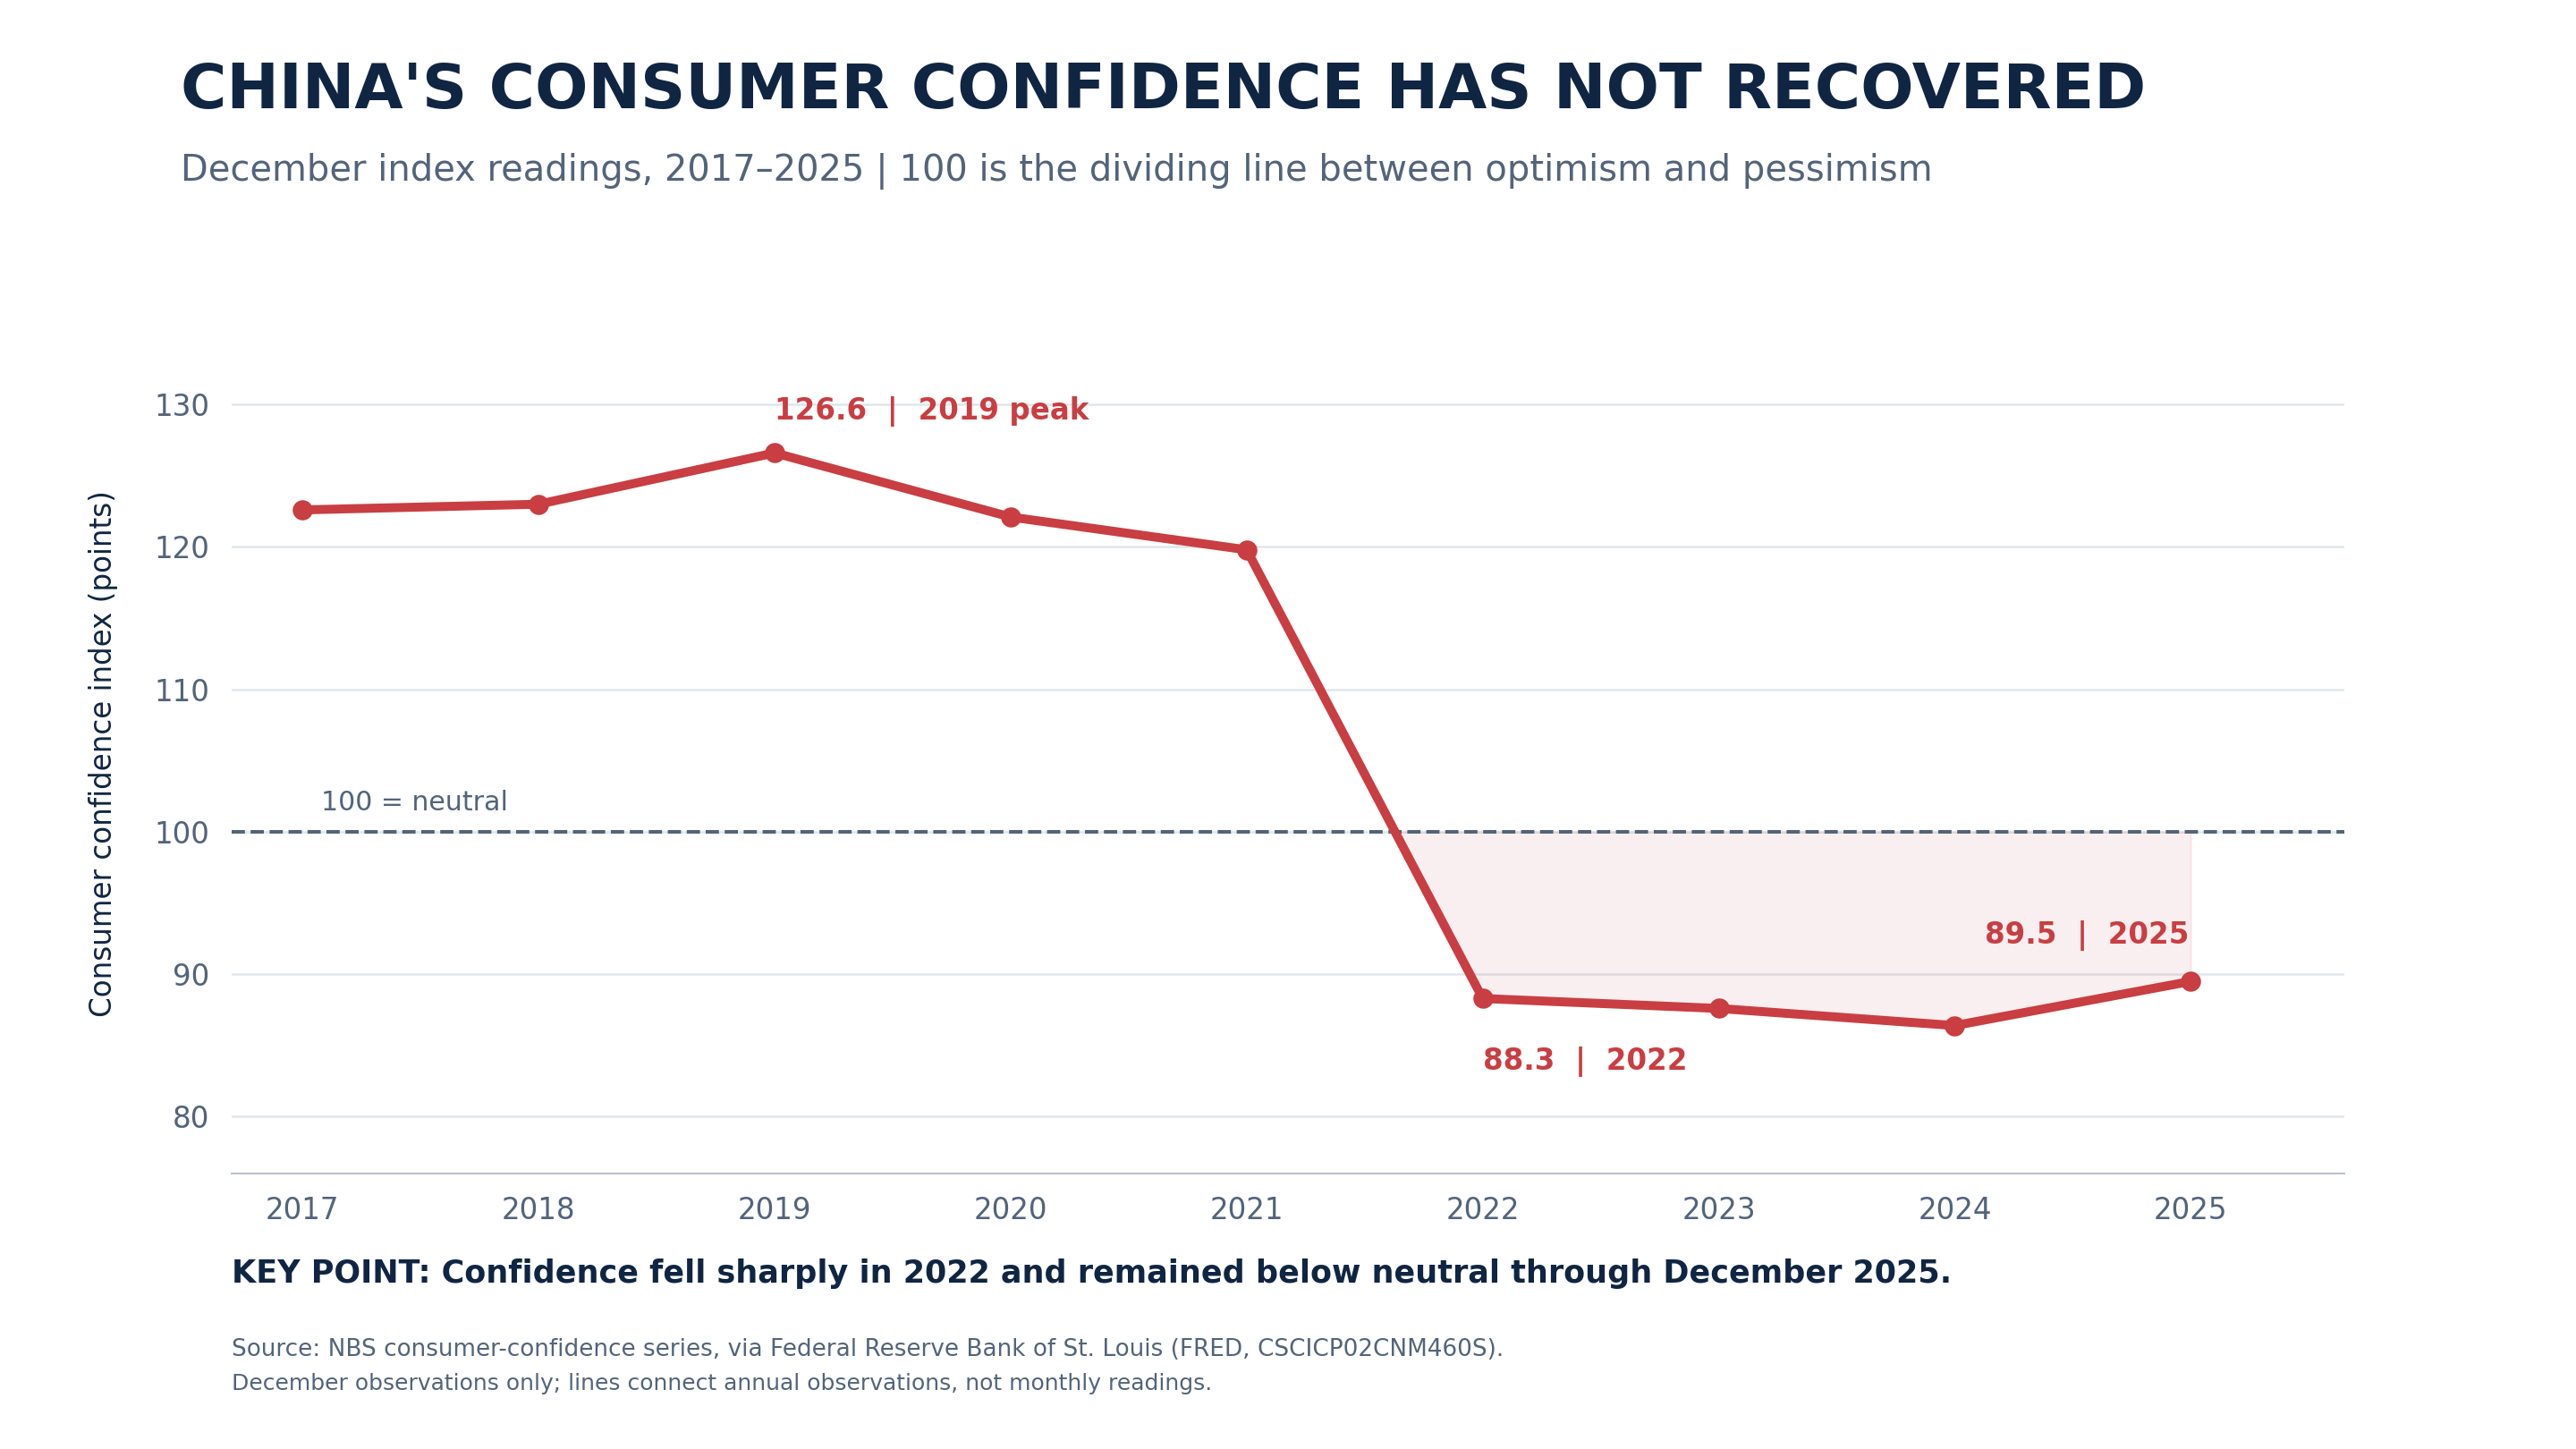
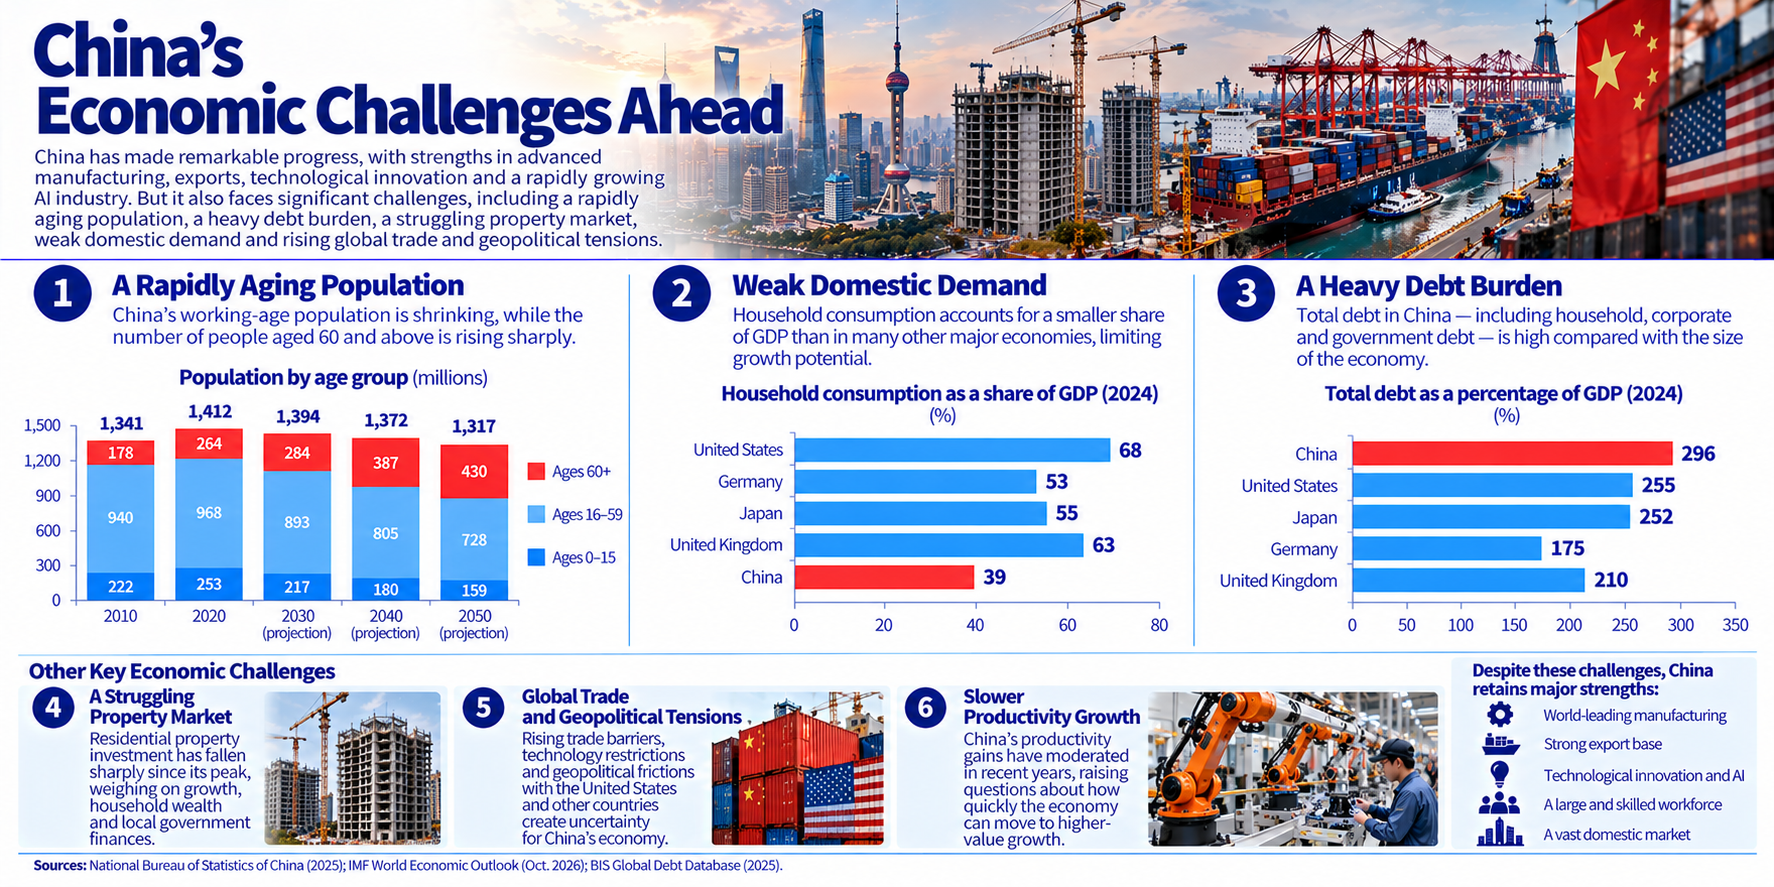
China’s economy is undergoing a profound transformation. The world’s second-largest economy remains a manufacturing powerhouse, a global trading giant and an increasingly important leader in emerging technologies. But beneath the impressive numbers lie significant challenges, including a struggling property market, weak consumer confidence, youth unemployment and simmering trade tensions.
Much of the global media coverage has tended toward the extremes: the rising economic power that will overtake the United States and end the American Century — or an over-levered, debt-fueled mess that cannot sustain the government-juiced growth of the past decade and is heading toward inevitable decline.
How can we make sense of these seemingly contradictory and overly simplistic visions?
Sometimes, the best way to understand a complicated economic story is to visualize it.
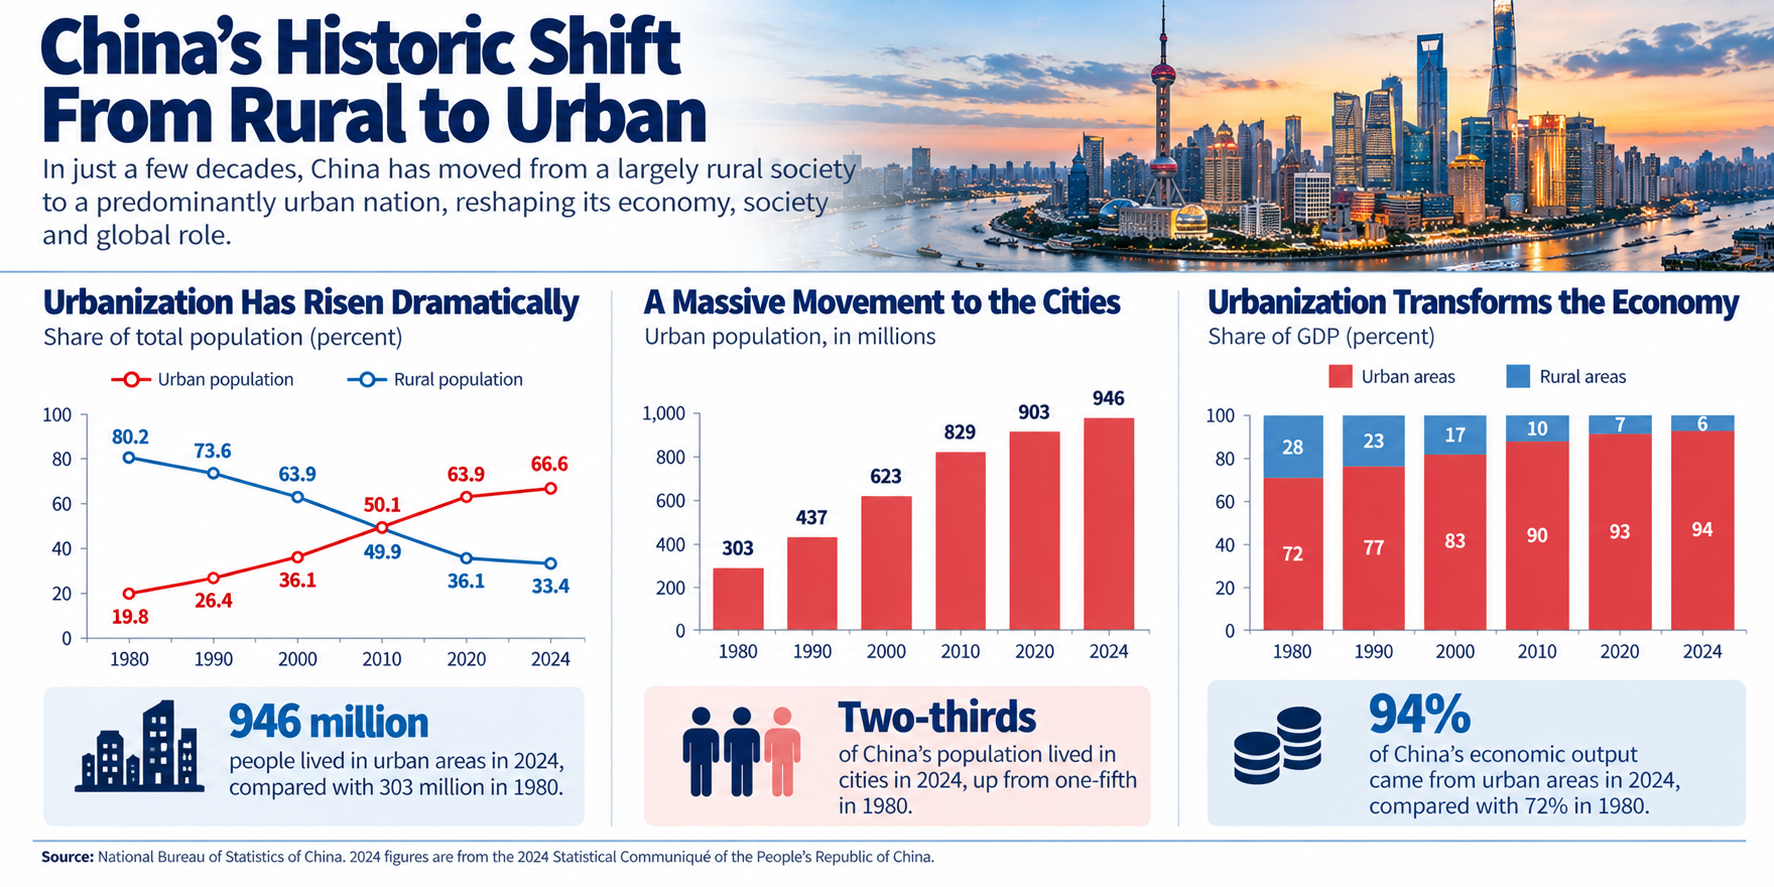
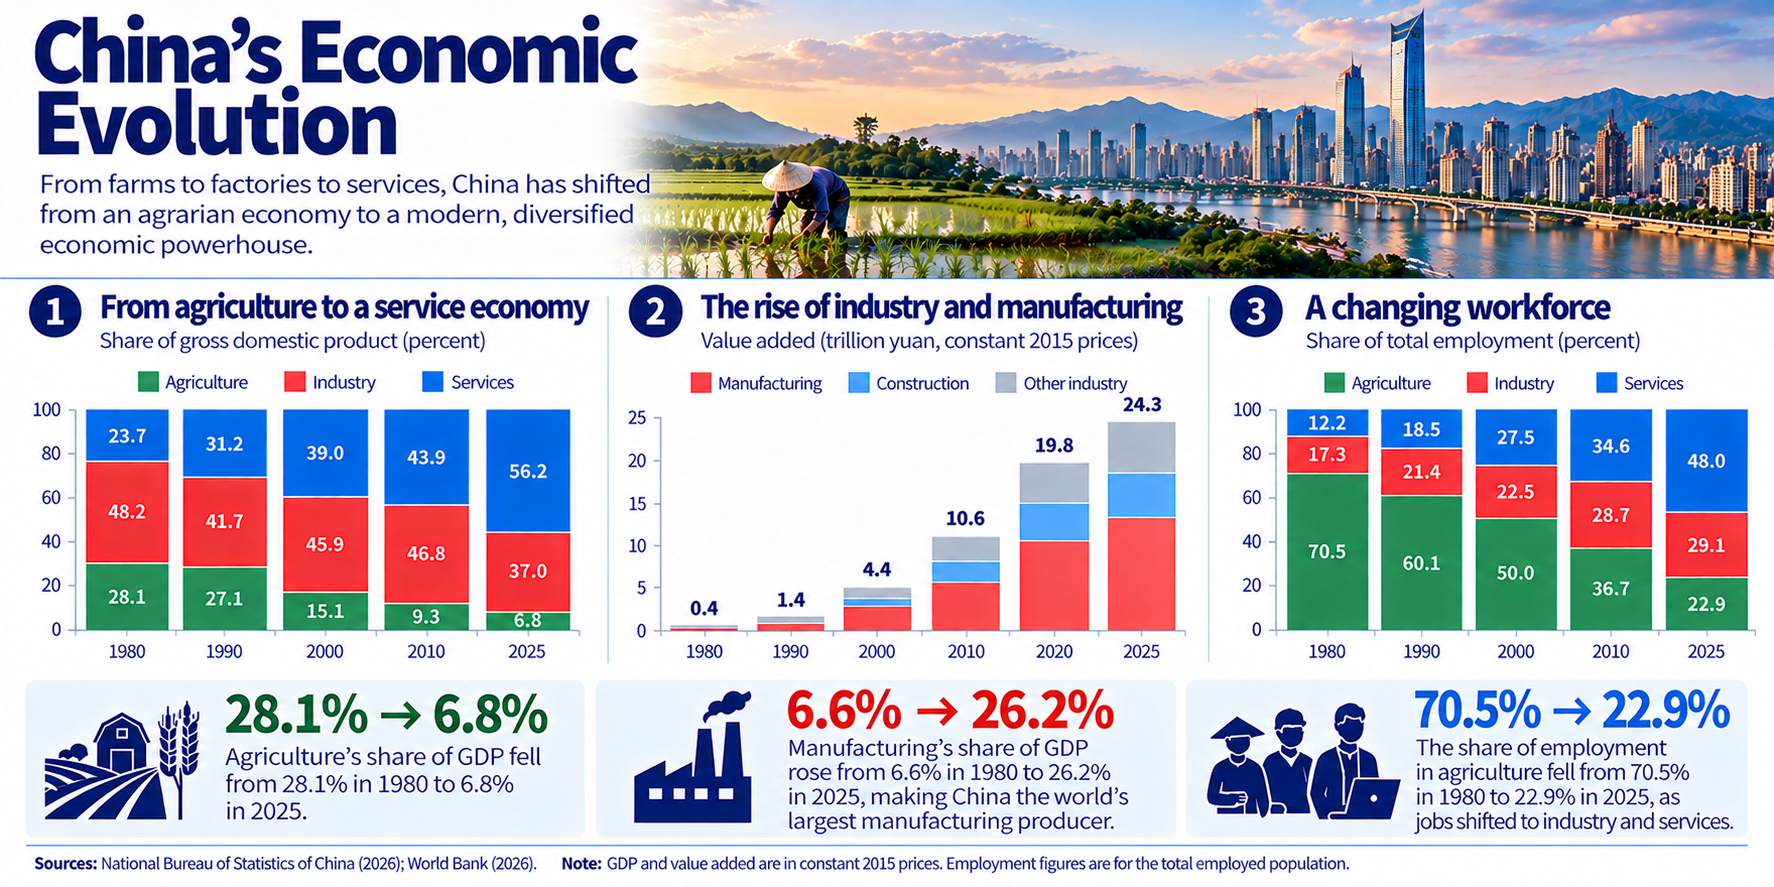
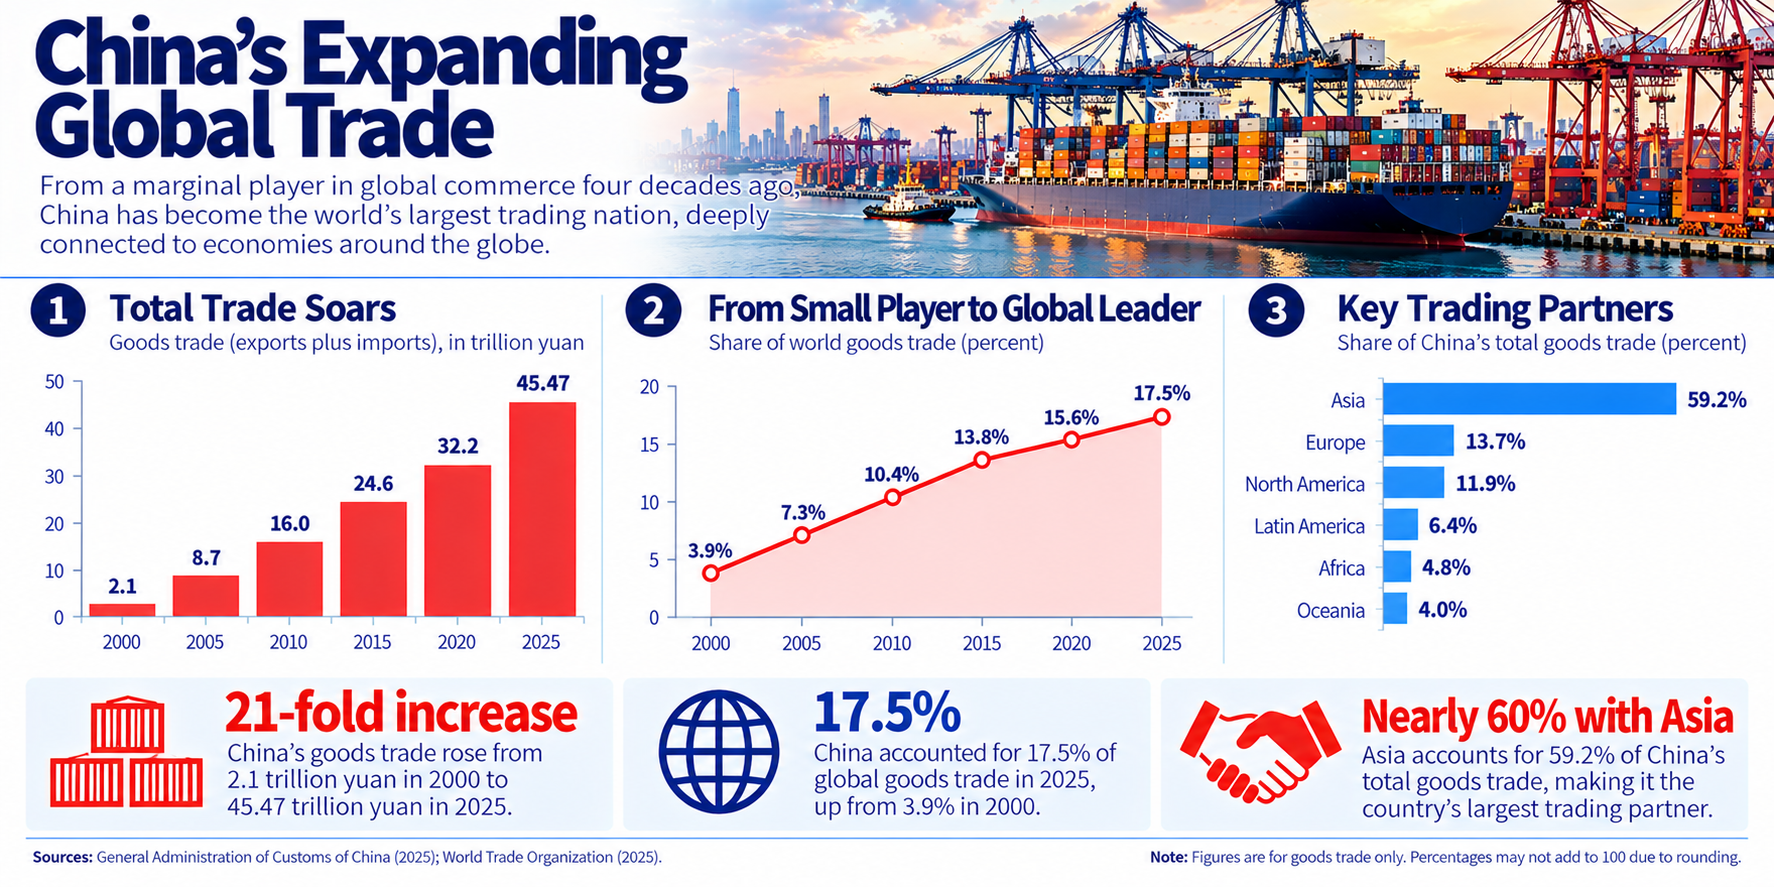
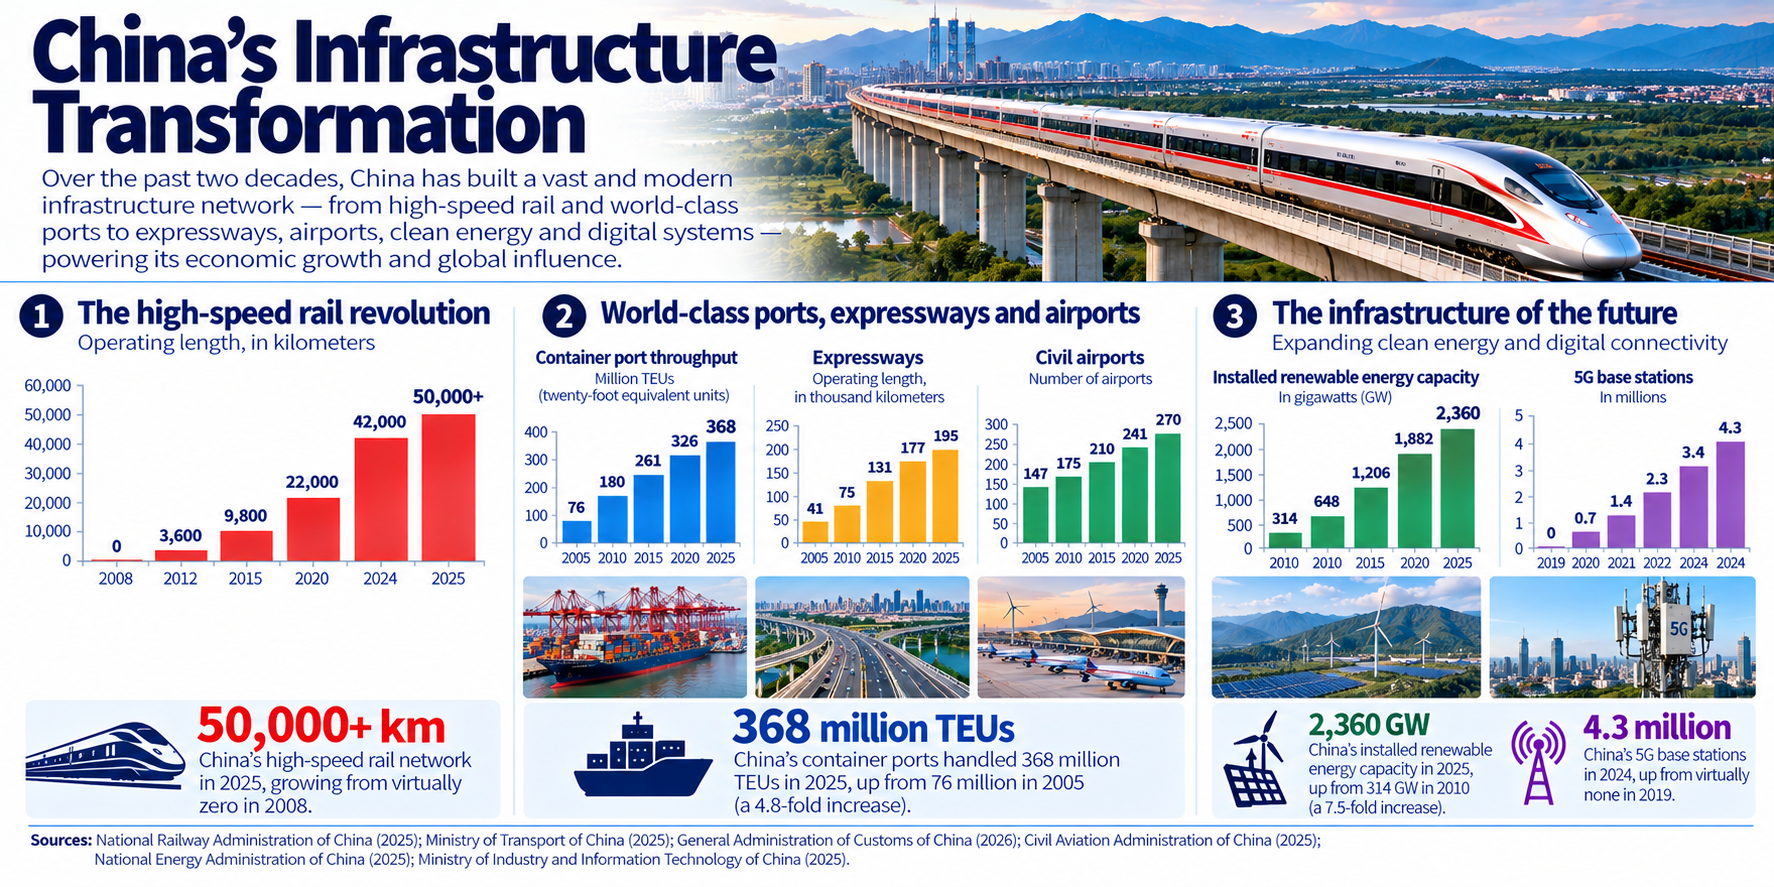
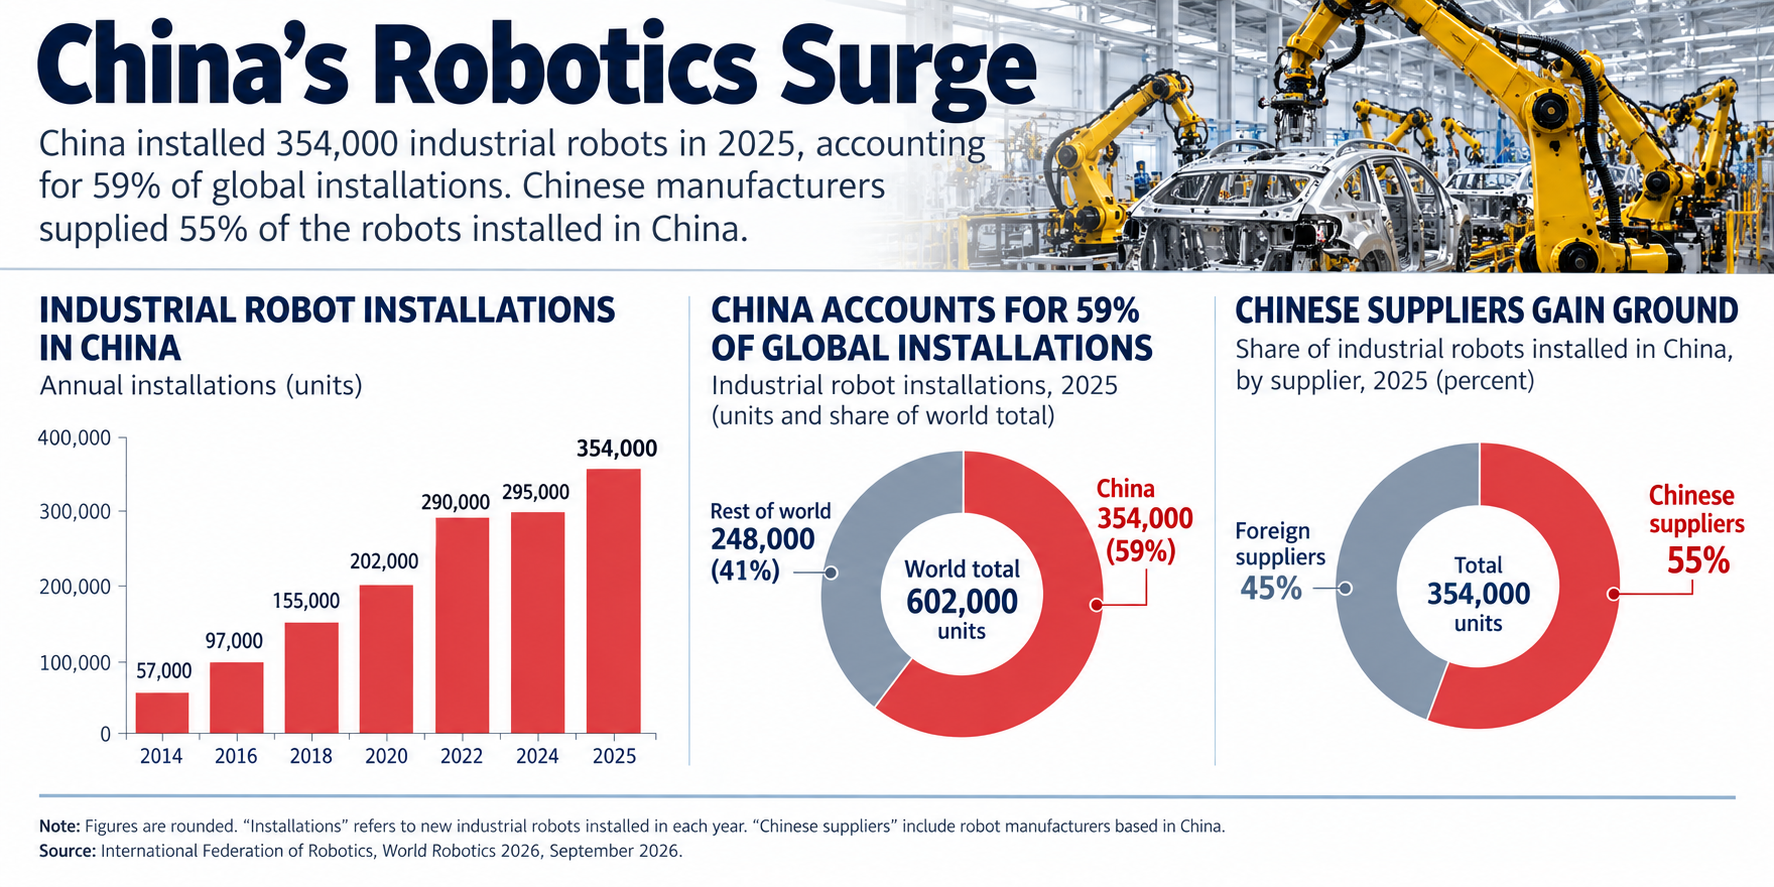
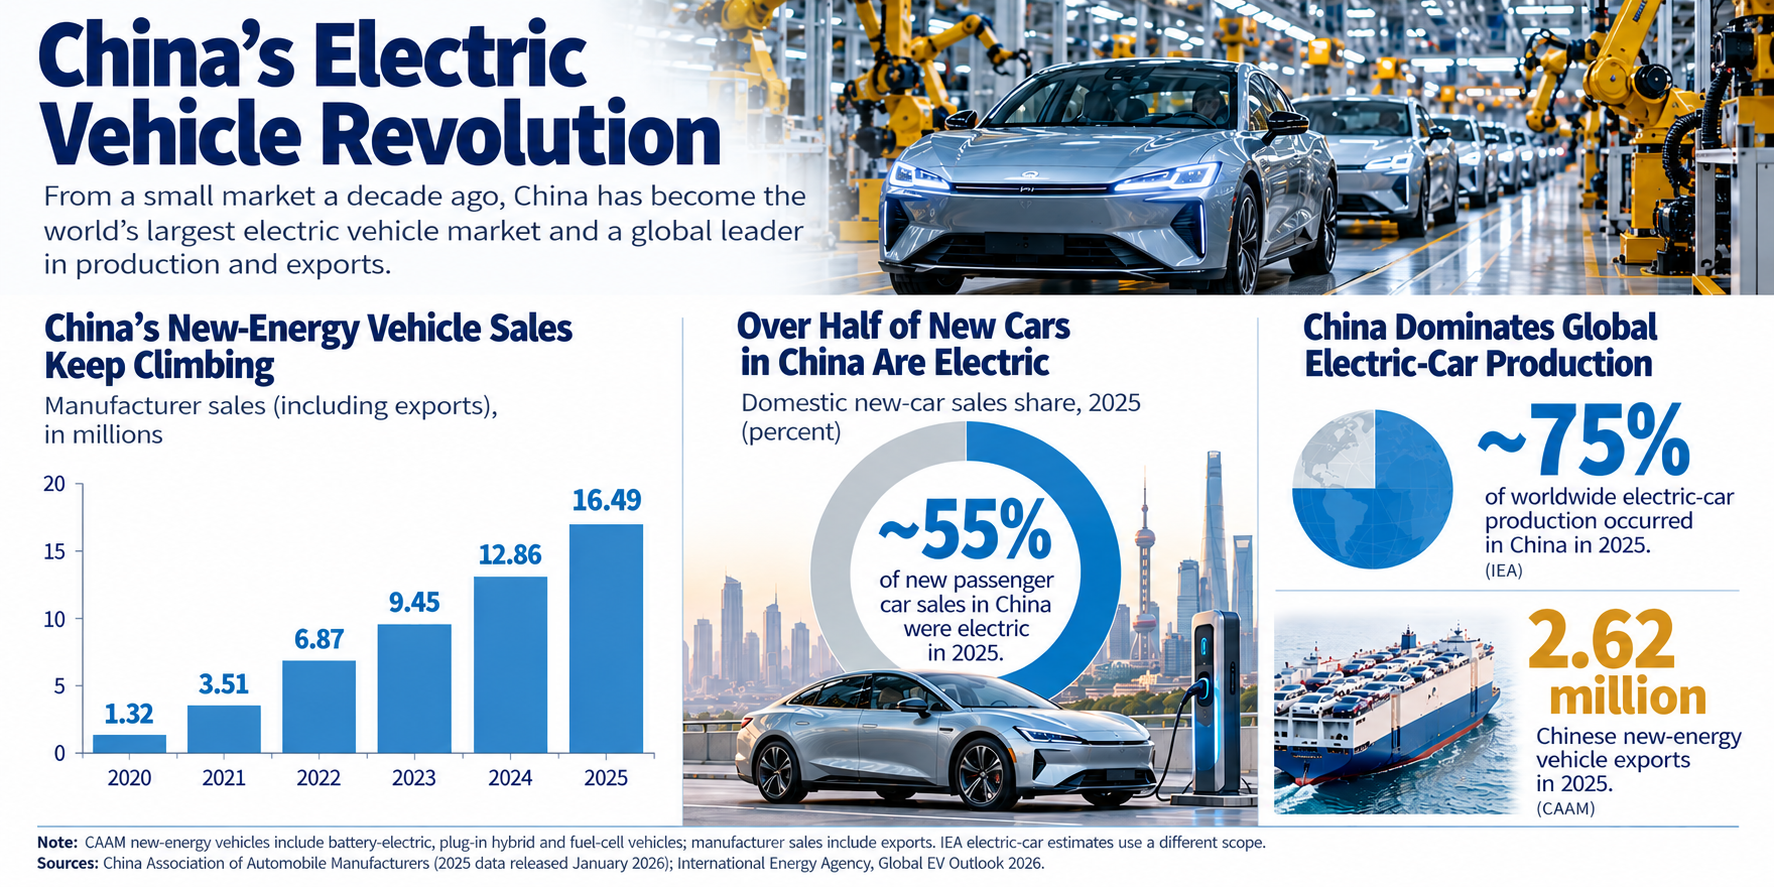
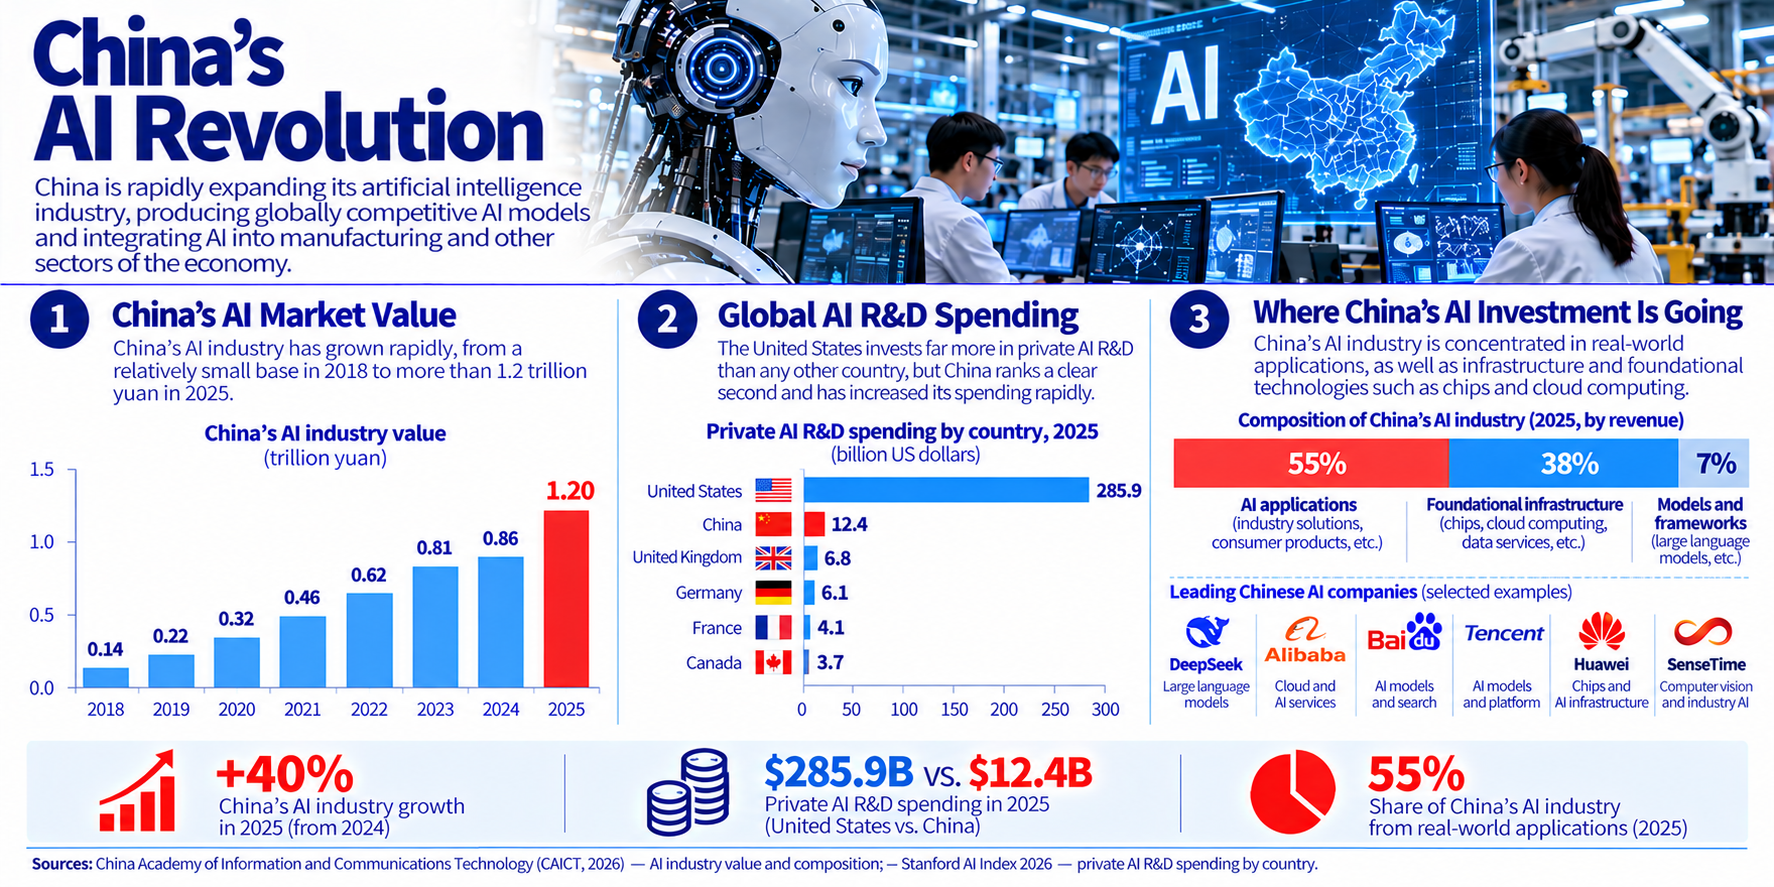
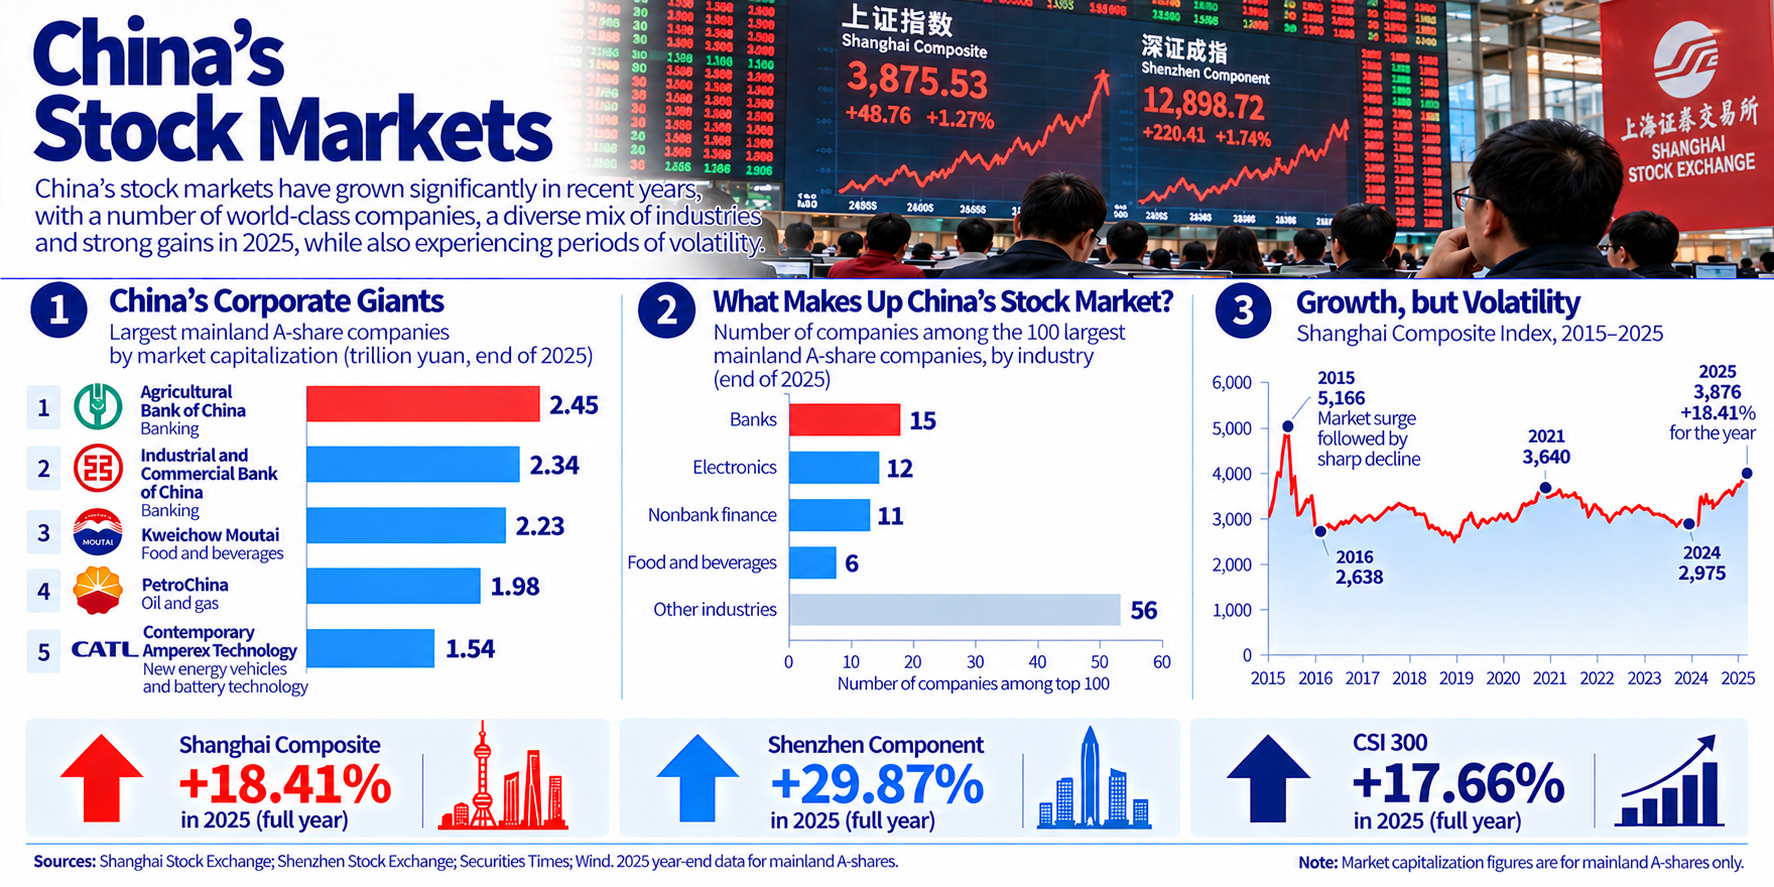
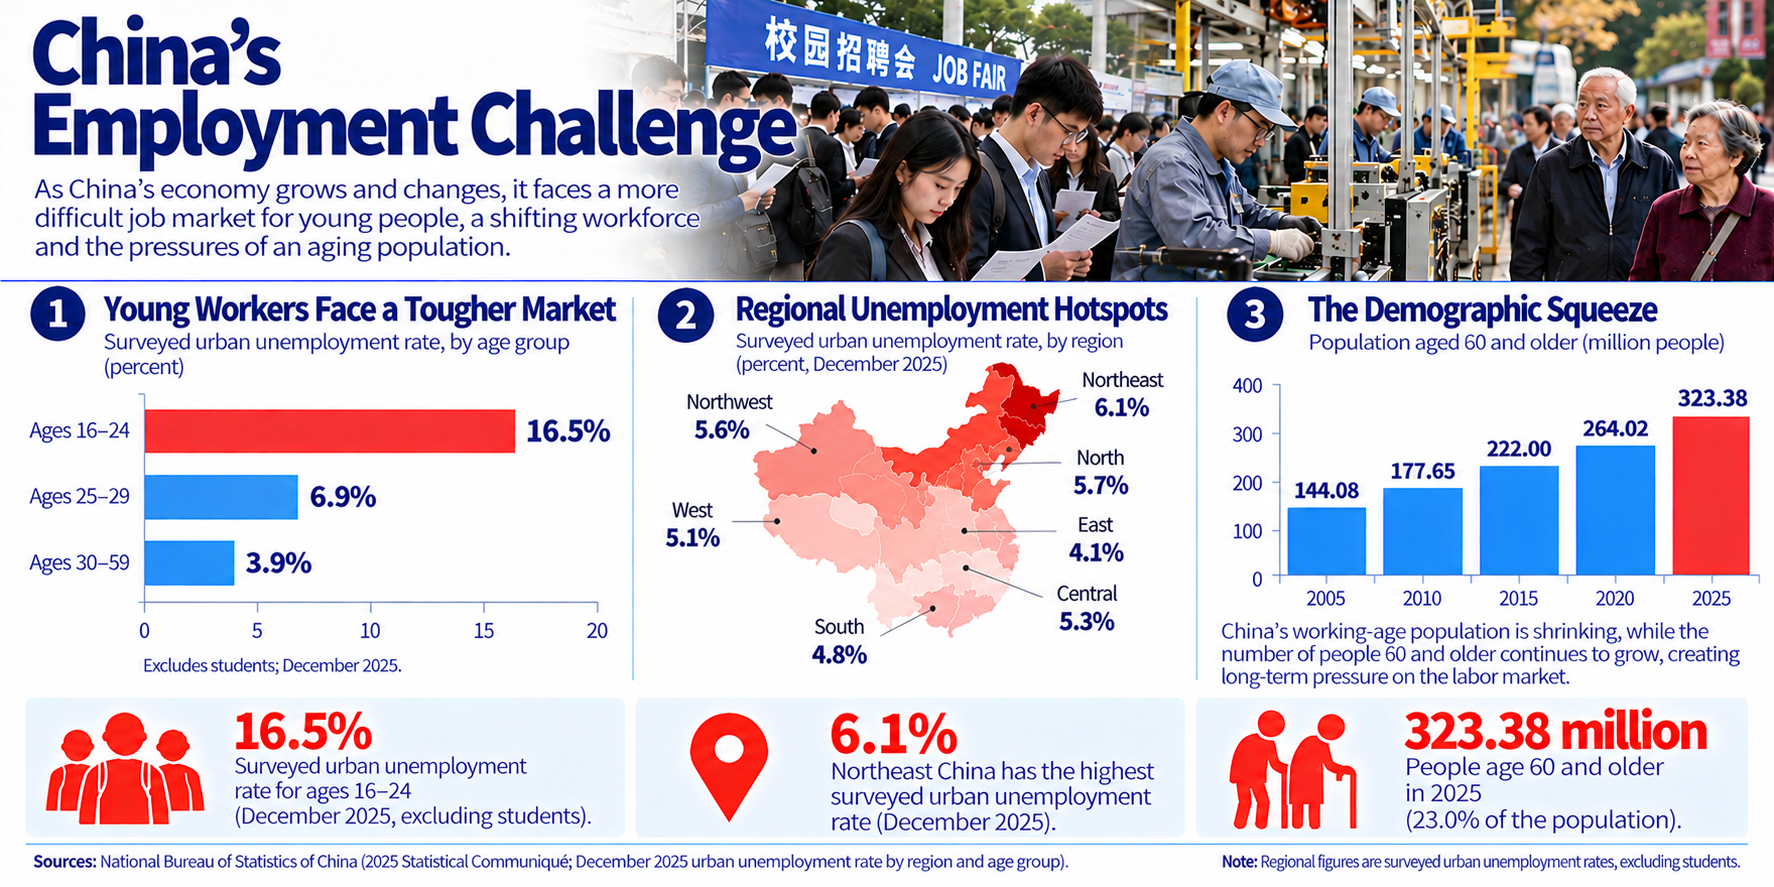
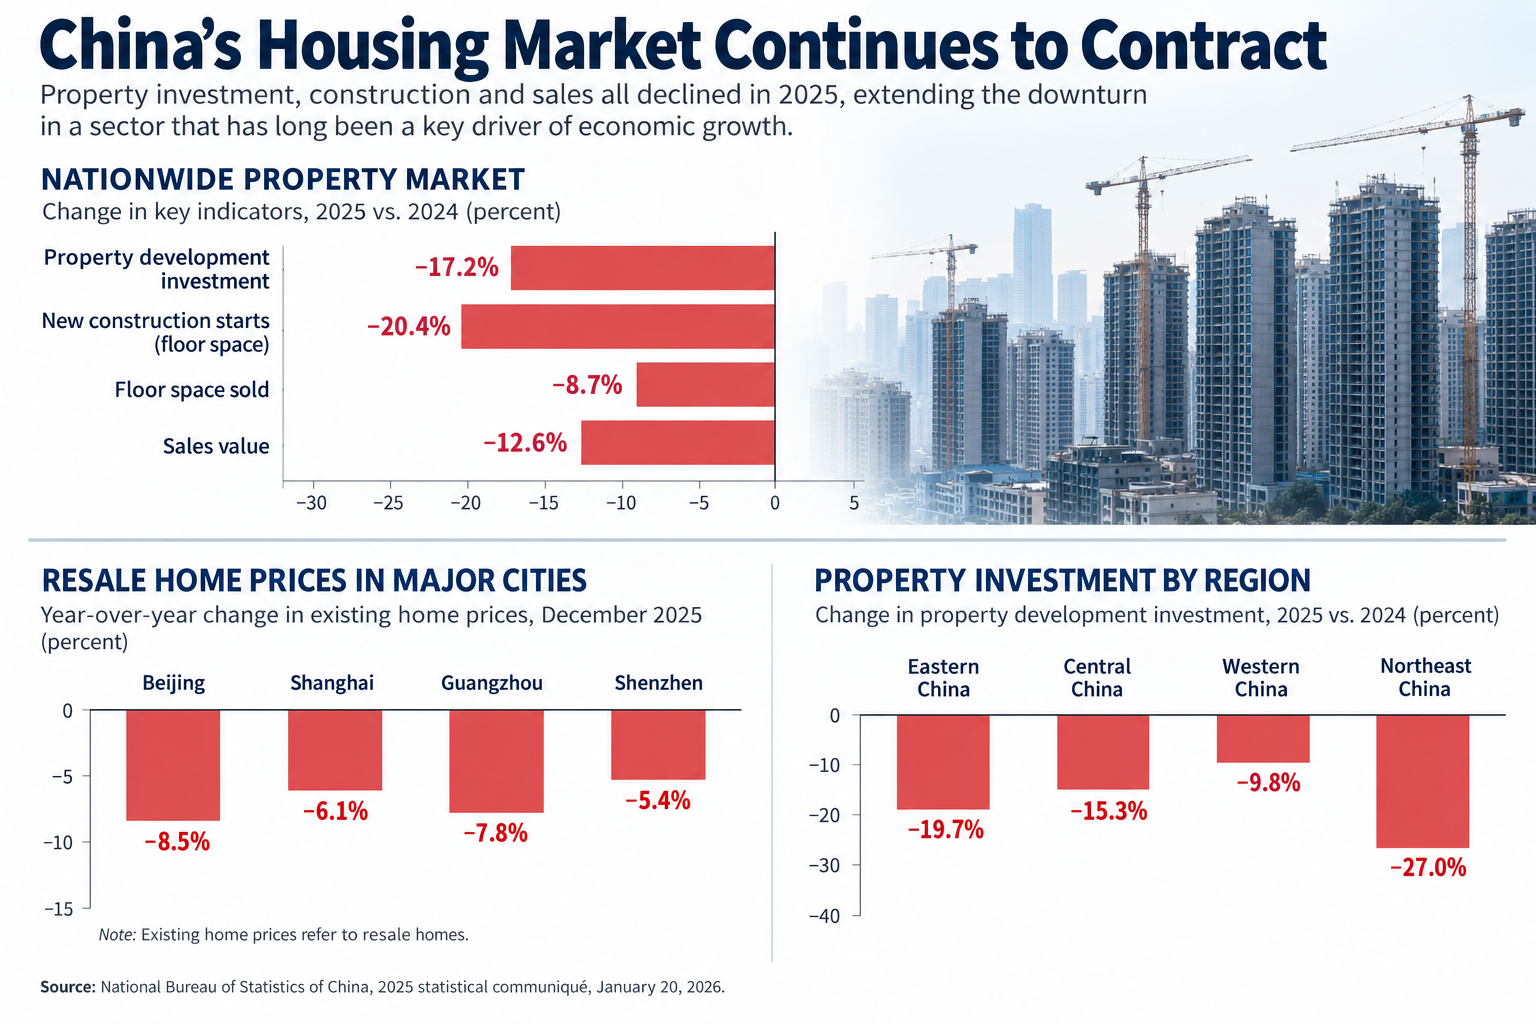
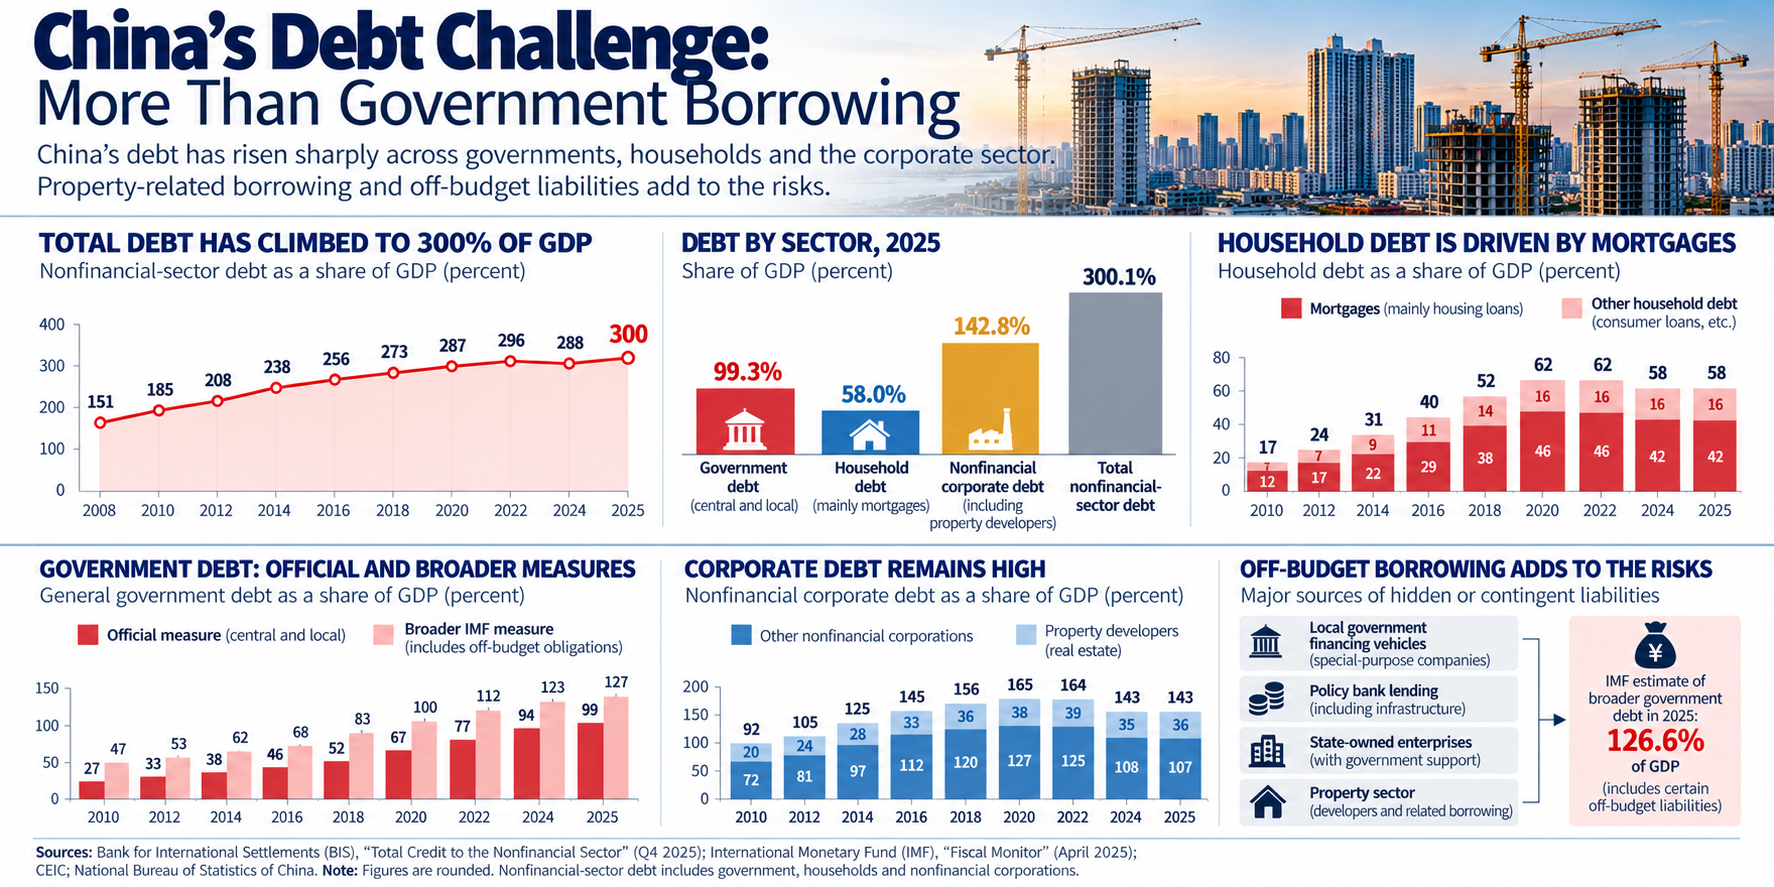
These 15 charts and infographics examine the state of China’s economy from several different perspectives. They explore the country’s changing economic structure, its expanding global trade relationships, the remarkable growth of electric vehicles and robotics, and its ambitions in artificial intelligence. They also examine the pressures facing Chinese households, workers, property owners and investors.
The graphics reveal an economy of striking contrasts: technological dynamism alongside structural weaknesses, global competitiveness alongside domestic uncertainty, and extraordinary industrial capacity amid questions about future growth.
No single statistic can adequately capture an economy as large and complex as China’s. Taken together, however, these visualizations provide a broader picture of where China stands today, how it got here and what may lie ahead.
They also demonstrate how data visualization can turn complicated economic statistics into accessible stories for an international audience. Enjoy! And please share your feedback and predictions.
Note: I used AI research to help me with find the latest data for this project. I tried to confirm all data that I used. If you see anything that is incorrect, please let me know and I will fix it.


Recent Comments