Analysis: How Big Will the Blue Wave Be in the Upcoming Midterms?
Posted: November 2, 2026 Filed under: U.S. politics | Tags: 2026 Election, American history, American politics, Blue Wave, Congress, Democrats, Donald Trump, history, news, politics, Republicans, trump, U.S. Congress Leave a comment
By RICK DUNHAM
The Democrats appear poised for a midterm victory. But the size of that victory — and whether it extends to the Senate —will depend on a surprisingly small number of highly competitive races.

The question is not whether the political environment favors Democrats in Tuesday’s midterm elections. By almost every analytical model and historical measure, it does. The question is how much of that advantage translates into seats in the House and particularly the Senate — and how many Republicans who have been considered safe discover, too late, that they were standing in the path of a big blue wave.
I covered the Republican revolutions of 1994 and 2010 and the Democratic takeover of Congress in 2006. One lesson from those elections is that waves often grow larger than the experts expect. A district that looks safely Republican in October can become competitive in November. That does not mean a Democratic landslide is inevitable in 2026. It means we should be careful about treating our final lists of toss-up races as the outer boundary on Election Day.
A referendum on Donald Trump
President Donald Trump has gotten his opt-repeated wish: This election a referendum on him. While Trump would defiantly disagree, that is a serious problem for Republican candidates. A late October Reuters/Ipsos poll placed his approval rating at 32%, near a record low. In the same survey, registered voters preferred Democratic control of Congress by 47% to 36%; among likely voters, the margin was 53% to 44%. One note of caution: While those are substantial leads, national preferences do not necessarily distribute themselves evenly across congressional districts.
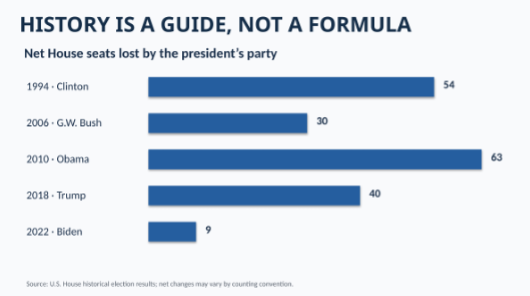
I can say from nearly five decades of covering American politics that history is not kind to the party occupying the White House in a midterm. The president’s party lost 54 House seats in 1994, 30 in 2006, 63 in 2010 and 40 in 2018. But huge setbacks are not guaranteed, even with an unpopular president. Republicans gained just nine in 2022 amid widespread unhappiness with President Joe Biden and rising prices — an important reminder that a predicted wave can become a ripple. Political conditions matter. But so does candidate quality, turnout, gerrymandering and events peculiar to individual races.
The pocketbook problem
Americans do not vote on gross domestic product. They vote on their own economic circumstances and their expectations for their families. In the polling cited in my presentation, 73% said the cost of living was moving in the wrong direction. Trump received just 26% approval for his handling of the economy and 17% for the cost of living. An AP-NORC finding cited in the deck indicated that 65% blamed his policies for driving up prices.
Democrats learned this lesson painfully in 2024. Inflation had multiple causes, including pandemic-era supply disruptions and the energy and grain shocks following Russia’s invasion of Ukraine. Many of those forces were beyond President Joe Biden’s control, but voters held his administration responsible. Trump promised to lower prices, some by 200%. (That’s definitely New Math.)
Instead, his tariffs and trade conflicts have made affordability a central political vulnerability. The precise contribution of any one policy to inflation is debatable.The electoral importance of voters’ perceptions is not. A key number: A majority of American voters now say they are dissatisfied with their own personal financial situation — for the first time since NBC News began asking this question in 1994. Eight years ago, when Republicans lost 40 House seats, more than 70% of Americans reported being satisfied with their own financial outlook midway through Donald Trump’s first term.
Health care, immigration, abortion, government competence and questions about corruption also matter. But the most useful early exit-poll numbers may not be which issue voters rank first. They may be which party voters trust to handle that issue — particularly the economy — and whether voters believe their own circumstances are stable or improving.
The popular vote is not the seat count
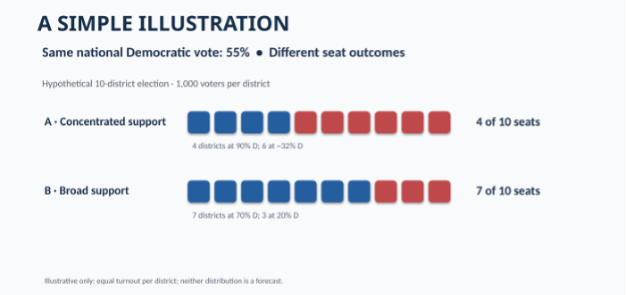
Democrats’ biggest challenge may be to translate a popular vote landslide nationally into victories in heavily gerrymandered House districts. This is the paradox at the heart of this election: Democrats could win a decisive nationwide House vote and still emerge with only a modest majority. Or they could win roughly the same vote share and capture dozens more seats. What matters most is whether Democrats win slim victories in Republican districts or mostly win landslides on heavily Democratic turf.
Imagine ten equally populated districts. In one model, Democrats win four districts overwhelmingly but lose the other six by relatively narrow margins. In another, they win seven districts by more modest margins. The national Democratic vote share can be identical in both examples, yet the seat totals are dramatically different. Votes piled up in a landslide district count in the national total, but they cannot elect additional representatives.
Three forces explain the disconnect: gerrymandering, the geographic concentration of like-minded voters and the decline of split-ticket voting. Mid-decade redistricting has added another complication. The Cook Political Report suggested a net Republican benefit of roughly three seats from the latest map changes, down from GOP’s best case scenario of 10 pickups. The lesson to greedy Republicans is that a favorable map is not a seawall. In a strong enough wave, seats drawn to be safe can suddenly become vulnerable.
Where the wave could reach
Start with the suburbs. Watch Northern Virginia, the Philadelphia suburbs, northern New Jersey, the areas around Detroit and Grand Rapids, and the growing metropolitan regions around Charlotte, Raleigh, Atlanta, Tampa, Orlando, Dallas and Houston. Are Democrats merely holding their previous margins, or are they expanding them? That distinction could determine control of the House and shape several Senate contests.
Then move outward. The signature of a truly broad wave would be smaller Republican margins in exurbs, working-class communities and rural counties — not just bigger Democratic majorities in already-blue cities. Watch places around Columbus, Cincinnati and Cleveland, Pennsylvania’s Lehigh Valley, the industrial Midwest and South Texas. Compare similar counties and districts with 2024, when Donald Trump made major inroads among Latino voters, young men and Black men. A caution: remember that partisan gerrymandering makes some congressional district comparisons to 2024 imperfect.
Population movement adds uncertainty. New arrivals from California, the Northeast and the Midwest have changed parts of Texas, the Carolinas, Florida, Arizona and Nevada. But migration alone does not tell us how people vote. New residents can be more conservative or more liberal than their neighbors, and they can be more shocked by corruption at the state level than longtime residents. Their states of origin are less important than their response to political shenanigans in their adopted state.

The Senate is a different battlefield
The House reflects a national political swing across hundreds of districts. The Senate reflects a much smaller collection of statewide contests, often in territory that voted for Trump in 2024. Democrats need a net gain of four seats from the 53–47 Republican starting point, because the vice president breaks ties for Republicans. Winning the House, even comfortably, would not guarantee control of the Senate.
Maine, Ohio, Iowa, Kansas, South Carolina and Texas deserve close attention, along with Republican-held seats in other states where high quality Democratic candidates have made races unexpectedly competitive. Example: Mississippi.
Democrats must also defend Michigan, where a Sunday morning endorsement of Republican nominee Mike Rogers by the Democratic primary loser, Haley Stevens, scrambled things. An unexpectedly close result in a state considered safely Republican such as Louisiana or Florida would be meaningful even if the Democrat loses: it could suggest that the wave is spreading beyond the expected battlegrounds.
Candidate quality can amplify or blunt the national tide. A strong local incumbent such as Maine Republican Susan Collins may survive a difficult year (although there is little protection against a tidal wave). A weak candidate such as Mississippi’s Cindy Hyde-Smith may lose a seat that should have been secure. Campaign money, advertising and turnout operations matter, too. That’s why we’re all looking at Texas, where sometimes-trillionaire Elon Musk has pumped in tens of millions of dollars in a rescue mission to save Republican Ken Paxton by sliming Democrat James Talarico on the issue of trans rights.
Information, enthusiasm and the unknown
Voters increasingly inhabit different information worlds. Cable television, partisan websites, podcasts, social video and political influencers can present sharply different versions of the same presidency. Republicans benefited from an influential podcast and online ecosystem in 2024. The balance may be changing, especially when podcast superstar Joe Rogan has become a sometimes-critic of Donald Trump and has welcomed Democrats including Texas’ Talarico to share his platform. Still, individual appearances or criticisms by disgruntled former MAGA acolytes are not, by themselves, proof of a nationwide shift.
Enthusiasm is another potential advantage for Democrats. Reuters/Ipsos figures showed 46% of Democrats, compared with 30% of Republicans, describing themselves as very enthusiastic wabout the midterms. While enthusiasm and early-voting statistics heavily favoring Democrats are not final turnout counts, they are important warning signs to Republican operatives. Without an extra-strong Election Day turnout, Republicans are facing major electoral challenges.
How big is the wave?
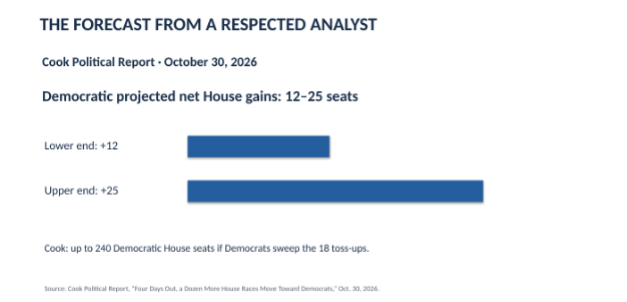
The authoritative, independent Cook Political Report’s October 30 forecast projected Democratic House gains of 12 to 25 seats, with a scenario reaching 240 Democratic seats if the party swept the toss-ups. A true blue tidal wave like the 1994 Newt Gingrich revolution could increase that total. The Cook estimate of 12 to 25 seats is a useful benchmark, not a ceiling or a guarantee. Polls have errors. Turnout models rely on assumptions. But as I always say, it’s better to be ahead in polls than behind. And it’s important to note that no respected independent polling analysts are predicting that Republicans maintain control of the House. So it’s only the size of the coming Democratic majority that’s uncertain.
There are several plausible endings. Democrats could win a narrow House majority while Republicans retain the Senate. They could sweep most competitive seats and win both chambers. A much larger wave could topple Republican incumbents in places nobody expected to be competitive. Or a pro-Republican riptide in most close districts could leave the GOP clinging to a tiny House majority despite a Democratic advantage in the national vote.
I will be watching one question above all others Tuesday night: Are Democrats winning only the races they were expected to win, or are supposedly safe Republican seats suddenly becoming toss-ups? The answer will tell us whether the blue wave is a torrent or a trickle.
>>> Read Rick Dunham’s 2026 Election Night cheat sheet
Rick Dunham’s 2026 Election Night cheat sheet
Posted: November 2, 2026 Filed under: U.S. politics | Tags: 2026 Election, American politics, cheat sheet, Congress, Democrats, Donald Trump, Republicans, U.S. Congress 1 CommentI have been crafting Election Night cheat sheets since 2000, when the presidential election between Al Gore and George W. Bush began unfolding at 6 p.m. and wasn’t finally decided until mid-December. Here is my latest installment in the series, analyzing the key bellwether contests that could decide which party controls Congress for the final two years of Donald Trump’s second term. Enjoy!

OVERVIEW
Election Day: Tuesday, November 3 • All times Eastern Standard Time (EST)
House: 435 seats; 218 normally needed for a majority if all seats are filled. Senate: Republicans entered the cycle with 53 seats to Democrats’ 47 (including independents caucusing with Democrats); Democrats need a net gain of four for control.
THE BIG QUESTION: How many districts outside the conventional battleground list become competitive? A nationwide House vote margin is not the same as a seat margin. Geographic concentration, redistricting, candidate quality and close-race outcomes matter.
LIKELIEST OUTCOMES — FILL IN AFTER FINAL FORECAST REVIEW
| Contained Democratic gain | The parties divide the competitive seats; House control remains close, with Democrats most likely to win a narrow majority. Republicans hold the Senate. |
| Expanding Democratic wave | Democrats win most toss-ups and reach Republican-leaning districts; Democratic Senate control is plausible. |
| Exceptional Democratic wave | Unexpected Republican seats fall in multiple regions; Democrats easily win Senate control |
| Republican riptide | Republicans outperform expectations in close districts, potentially retaining the House and Senate. |
ELECTION KEYS: WHAT TO WATCH
Demographics: college-educated suburban voters; non-college voters; young men and women; young Black and Hispanic men; Latino working-class communities; Mexican-Americans along the southern border; Black turnout in the South, Ohio and Michigan; independents; older voters; union households.
Geography: Virginia exurbs; Atlanta and Charlotte suburbs; Pennsylvania’s Lehigh Valley and northeastern counties; Pennsylvania’s Pennsylvania Dutch area in the southeast; Michigan industrial areas; Michigan’s suburbs of Detroit and Grand Rapids; New York and New Jersey suburbs; Texas border communities; Texas’ suburbs of Fort Worth (Tarrant County), Dallas, and Houston; Texas’ exurbs of Austin and San Antonio; California competitive districts.
Issues: prices and purchasing power; presidential approval; corruption and democracy; corporate wealth and income inequality; immigration; war and Trump foreign policy; abortion; healthcare; government competence; trade and tariffs. Measure issue importance separately from which party voters trust.
Early exit poll question results (potentially available from 6 p.m.): issue priorities, direction of country, presidential approval, personal economic circumstances, corruption. Initial figures may change and are not vote projections.
INDICATIONS OF AN EXPANDING DEMOCRATIC WAVE
Democrats win Republican-held seats beyond the toss-up column; Republican margins narrow in traditionally safe territory; Democratic gains appear in several regions rather than only affluent suburbs; Republican Senate incumbents struggle in multiple states.
INDICATIONS OF A REPUBLICAN RIPTIDE
Republicans hold suburban toss-ups, retain expected Republican Senate seats, and overperform in working-class or rural counties; Democratic gains remain concentrated in districts they already dominate.
POLL CLOSING TIMES — EST
Some states have staggered closings. A closing time does not mean a race can immediately be projected. New Hampshire local closings vary. Check state election offices for last-minute orders.
| 6:00 p.m. | Indiana and Kentucky (Eastern portions) |
| 7:00 p.m. | Georgia, South Carolina, Vermont, Virginia; most Florida; remaining Indiana/Kentucky; some New Hampshire |
| 7:30 p.m. | North Carolina, Ohio, West Virginia |
| 8:00 p.m. | Alabama, Connecticut, Delaware, D.C., Illinois, Maine, Maryland, Massachusetts, Mississippi, Missouri, New Jersey, Oklahoma, Pennsylvania, Rhode Island, Tennessee; portions of Florida, Kansas, Michigan, North Dakota, South Dakota, Texas; remaining New Hampshire |
| 8:30 p.m. | Arkansas |
| 9:00 p.m. | Arizona, Colorado, Iowa, Louisiana, Minnesota, Nebraska, New Mexico, New York, Wisconsin, Wyoming; portions of Kansas, Michigan, North Dakota, South Dakota, Texas |
| 10:00 p.m. | Montana, Nevada, Utah; portions of Idaho and Oregon |
| 11:00 p.m. | California, Washington; remaining Idaho and Oregon |
| Midnight | Hawaii; most of Alaska |
| 1:00 a.m. Wednesday | Western Aleutian Islands, Alaska |
KEY EARLY RACES TO WATCH — SENATE
SENATE MATH: Democrats need a net gain of four seats. Every Republican pickup in a Democratic-held seat increases the number of Republican-held seats Democrats must flip.
| 7:00 — Georgia | Ossoff (D): gauge whether Republican challenge breaks through; victory by more than 5 percentage points is good news for Democrats. Cook: Likely D. |
| 7:00 — South Carolina | Graham (R): Appointed senator Darline Graham is at risk of losing the seat long held by her late brother Lindsey after running a terrible campaign. A narrow win means Republicans have a shot at holding the Senate. A Democratic victory is an early indicator of a GOP meltdown. Cook: Lean R. |
| 7:30 — North Carolina | Open Republican seat: key Democratic pickup opportunity; Roy Cooper victory by more than 8 points is an early sign of strong Democratic tide. Cook: Likely D. |
| 7:30 — Ohio | Husted (R): important Republican-held toss-up. Warning: Early Ohio vote counts often favor Democrats, so examine which counties and ballot types have reported before drawing conclusions. A Sherrod Brown victory is essential to Democratic Senate control. Cook: Toss-up. |
| 8:00 — New Hampshire | Open Democratic seat; rare Republican pickup opportunity. An upset victory by Republican Sununu would be a sign of a contained Democratic wave. Cook: Lean D. |
| 8:00 — Maine | Collins (R): Republican-held toss-up. Collins is trailing in most polls but has defied predictions of defeat in the past. A clear Jackson victory would be a strong sign of a Democratic wave. Cook: Toss-up. |
| 8:00 — Mississippi | Hyde-Smith (R): Weak GOP incumbent has seen her lead slipping in polls. A close election means a Democratic trend nationally; a Democratic victory in a solidly Republican state is a harbinger of massive gains. Cook: Likely R. |
| 9:00 — Michigan | Open Democratic seat: critical Democratic defense; Republican Mike Rogers is the only candidate in position to win a Democratic seat. Warning: Early counts can be misleading in Michigan; examine reporting jurisdictions and ballot types. Cook: Toss-up. |
| 9:00 — Texas | Open Republican seat: test of the wave’s geographic reach; Democrats haven’t won a U.S. Senate seat in Texas since 1988. A James Talarico victory would be a sign of a Democratic wave. Cook: Toss-up. |
| 9:00 — Iowa | Open Republican seat: Democrat Josh Turek versus Republican Ashley Hinson. Cook: Toss-up. |
| 9:00 — Kansas | Marshall (R) versus Adam Hamilton (D): Momentum has been with the Democrats in a state that last elected a Democratic U.S. senator in 1932 (George McGill). Another test of a national wave. Cook: Toss-up. |
| 9:00 — Nebraska | Ricketts (R): Independent Dan Osborn has remained remarkably competitive against a strong Republican incumbent. Pete Ricketts’ defeat would confirm the trend of massive Republican losses. Cook: Lean R. |
| 1:00 a.m. Wed. — Alaska | Sullivan (R) versus Mary Peltola (D): A Republican-held toss-up whose late returns could help determine Senate control if the national Democratic wave is modest. Most Alaska polls close at midnight EST, with the western Aleutians at 1 a.m. This is the opposite of an early indicator. Final results may take days. Cook: Toss-up. |
5 tips to create an addictive podcast experience (video)
Posted: October 30, 2026 Filed under: Journalism Training | Tags: audio journalism, journalism tips, Journalism Training, podcasts Leave a comment
Podcasts have become a popular way to share stories, ideas, and information. But with so many options available, how do you make your podcast stand out and keep listeners coming back episode after episode?
Creating an addictive podcast experience means building a connection that feels personal, engaging, and rewarding. This video presents five practical ways to make your podcast more addictive and keep your audience hooked.
10 tips to strengthen your editing skills
Posted: October 28, 2026 Filed under: Uncategorized Leave a comment
Sylvia Smith is a retired reporter and editor. She first presented these tips as part of the Global Business Journalism Lecture Series.
Write short. It’s much harder than writing long. Although there’s infinite space online, there is not infinite attention among readers.
If you are editing a story, your goal is to shorten and enliven the article so it will attract (and keep) the attention of your readers.
Here are 10 editing tips that will help you tighten and sharpen news stories:

1. Read each paragraph from the bottom up. You are looking for missing words, improper punctuation, and bad syntax. By reading from the bottom, you will focus on the basics of English writing and are more likely to identify mistakes.
2. Read the article aloud. If you have to take a breath in a sentence, that sentence is too long. Shorten it.
3. Make “bullets” ( ● ) your friends. Organize your stories by creating bulleted lists. This can help you avoid awkward or wordy transitions.
4. Know your audience. Don’t use terminology those readers will not encounter in everyday life. Use references they will understand.
5. Avoid certain words for the sake of clarity or conciseness. Examples:
- Most synonyms for “said.”
- “In order to.” The word “to” suffices.
- “Start to.” In almost all cases, the verb that comes after “start to” can stand on its own.
- “That” after an action verb. No: She said that Mondays are good days. Yes: She said Mondays are good days.
- “Really” and “very,” as in “really fun” or “very hard.” Neither adds any precision, so why use it?
- “Currently.” If you use a present-tense verb (such as “is”), “currently” is redundant. No: I currently have a cold. Yes: I have a cold.
- Many “ing” words. They often complicate sentences and add unnecessary words. No: Legislation establishing a commission or Legislation to establish. Better: set up. No: I am going to travel to Canada. Yes: I will go to Canada. No: I will be fighting for change. Yes: I will fight for change.
6. Look for redundant phrases: brand new; absolutely essential; tragic death; consensus of opinion; circle around. Eliminate the redundancy. Shorter and simpler: new, essential, death, consensus, circle.
7. Small edits can add up to big savings (in the length of your story). If you can cut six words in each paragraph of the average 250-word article, that’s about 60 words (or two paragraphs) of additional information you can add. Your “trims” can add up.
8. Ask whether the first paragraph (or two) of the story is necessary. Often, the lead (or “lede”) of your story is buried several sentences into the story.
Here’s an example from the early days of the coronavirus pandemic in the United States:
Art studios may not meet the criteria for “essential business,” but for many artists they are essential to making a living.
Lisa Hersey is a self-employed bookbinder who operates her business, Antler Editions, out of a studio at Cottage Street Studios, where she also works with another artist in the building as an employee. Both businesses were shuttered this week as Gov. Charlie Baker ordered all nonessential businesses to cease in-person operations.
“I have no income, except for my very small unemployment check that I’m getting right now,” Hersey said Thursday.
Hersey may be cut off from her studio, but in that sense, she’s not alone in this city of artists….
Hersey understands the safety need for the order, but noted, “I also need to pay my bills that aren’t stopping.”
Here’s a revised version of the same story that is shorter and more focused:
Barred from her one-woman bookbinding studio because of the state’s closure of all nonessential businesses, Lisa Hersey is scraping by.
“I have no income except for my very small unemployment check.”
Hersey understands the safety need for the order, but “I also need to pay my bills.”
It’s a bind Hersey shares with many other artists, including her neighbors at the Cottage Street Studios.
9. Let the article “cook.” Go to lunch, work on something else, grab a coffee. Come back and read it with fresh eyes. You may find something else to cut.
10. To practice your editing skills, give yourself this assignment on something you have written: How can I reduce it by 50 words without omitting anything important? Good luck.
Sylvia Smith is a retired reporter and editor. She was Washington Editor of the Journal Gazette (Fort Wayne, Indiana), Executive Editor of AARP Publications, Executive Editor for AARP Content, and Features Editor for State News at AARP Bulletin. She served as president of the National Press Club in its centennial year, 2008.
The state of China’s economy in 15 charts: Growth, challenges and expanding global role
Posted: October 21, 2026 Filed under: AI, Discovering China | Tags: AI, Artificial Intelligence, China, Chinese economy, consumer confidence, debt, economy, global economy, history, housing, infrastructure, international economics, international trade, news, politics, retail sales, robotics, stock market, unemployment Leave a comment
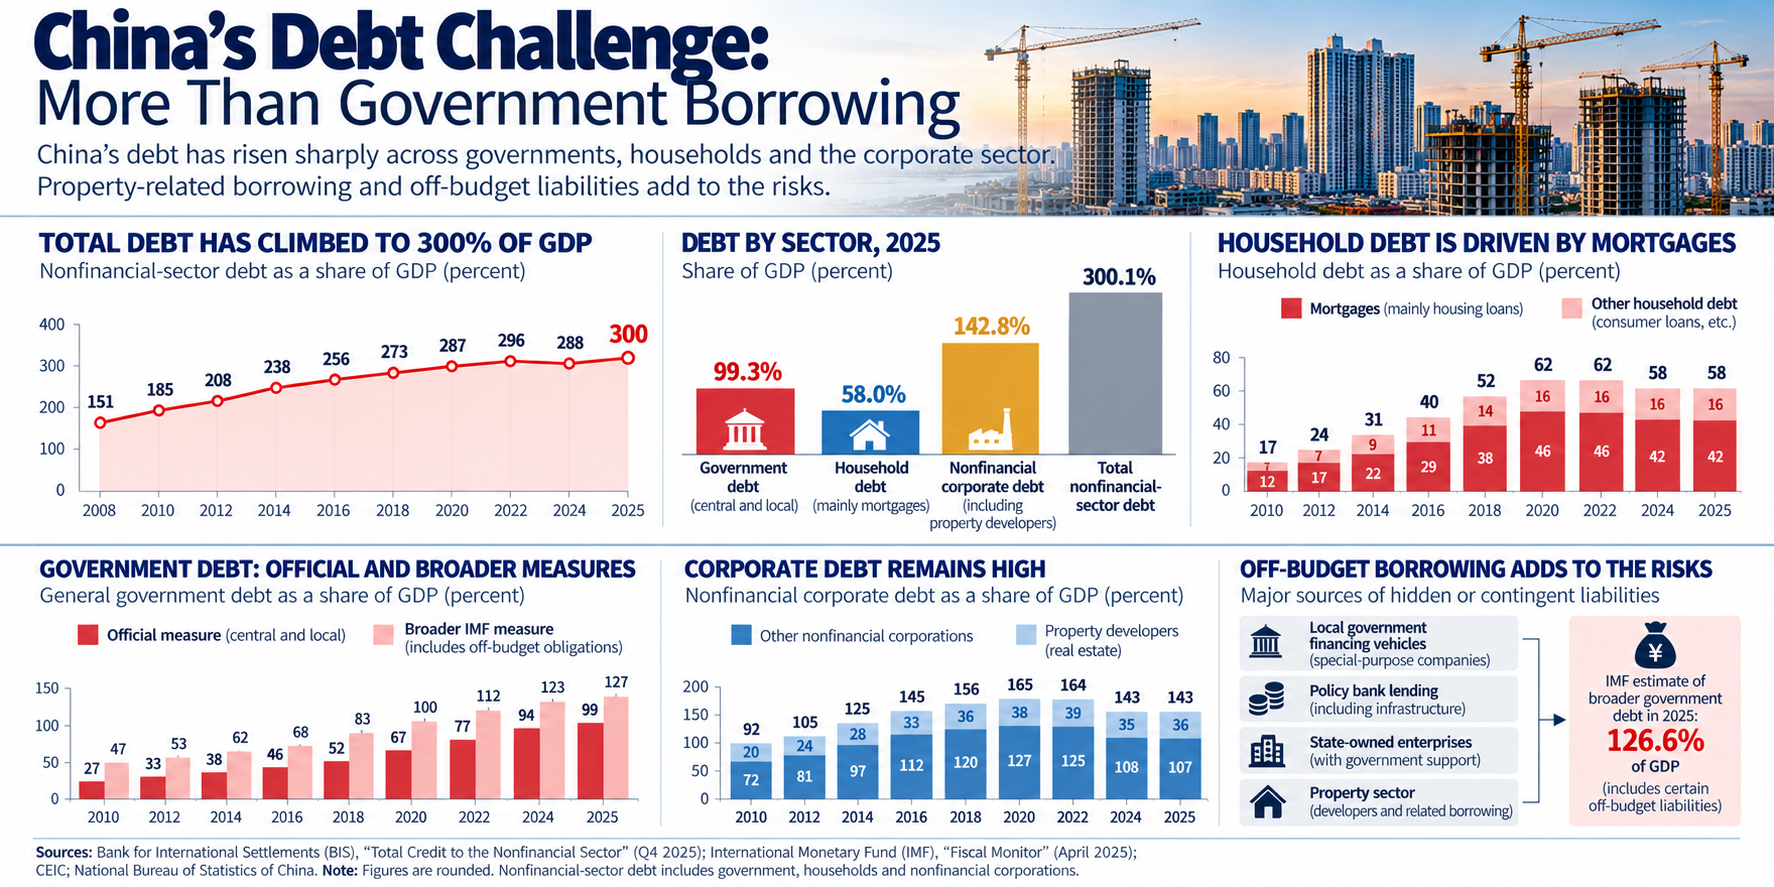
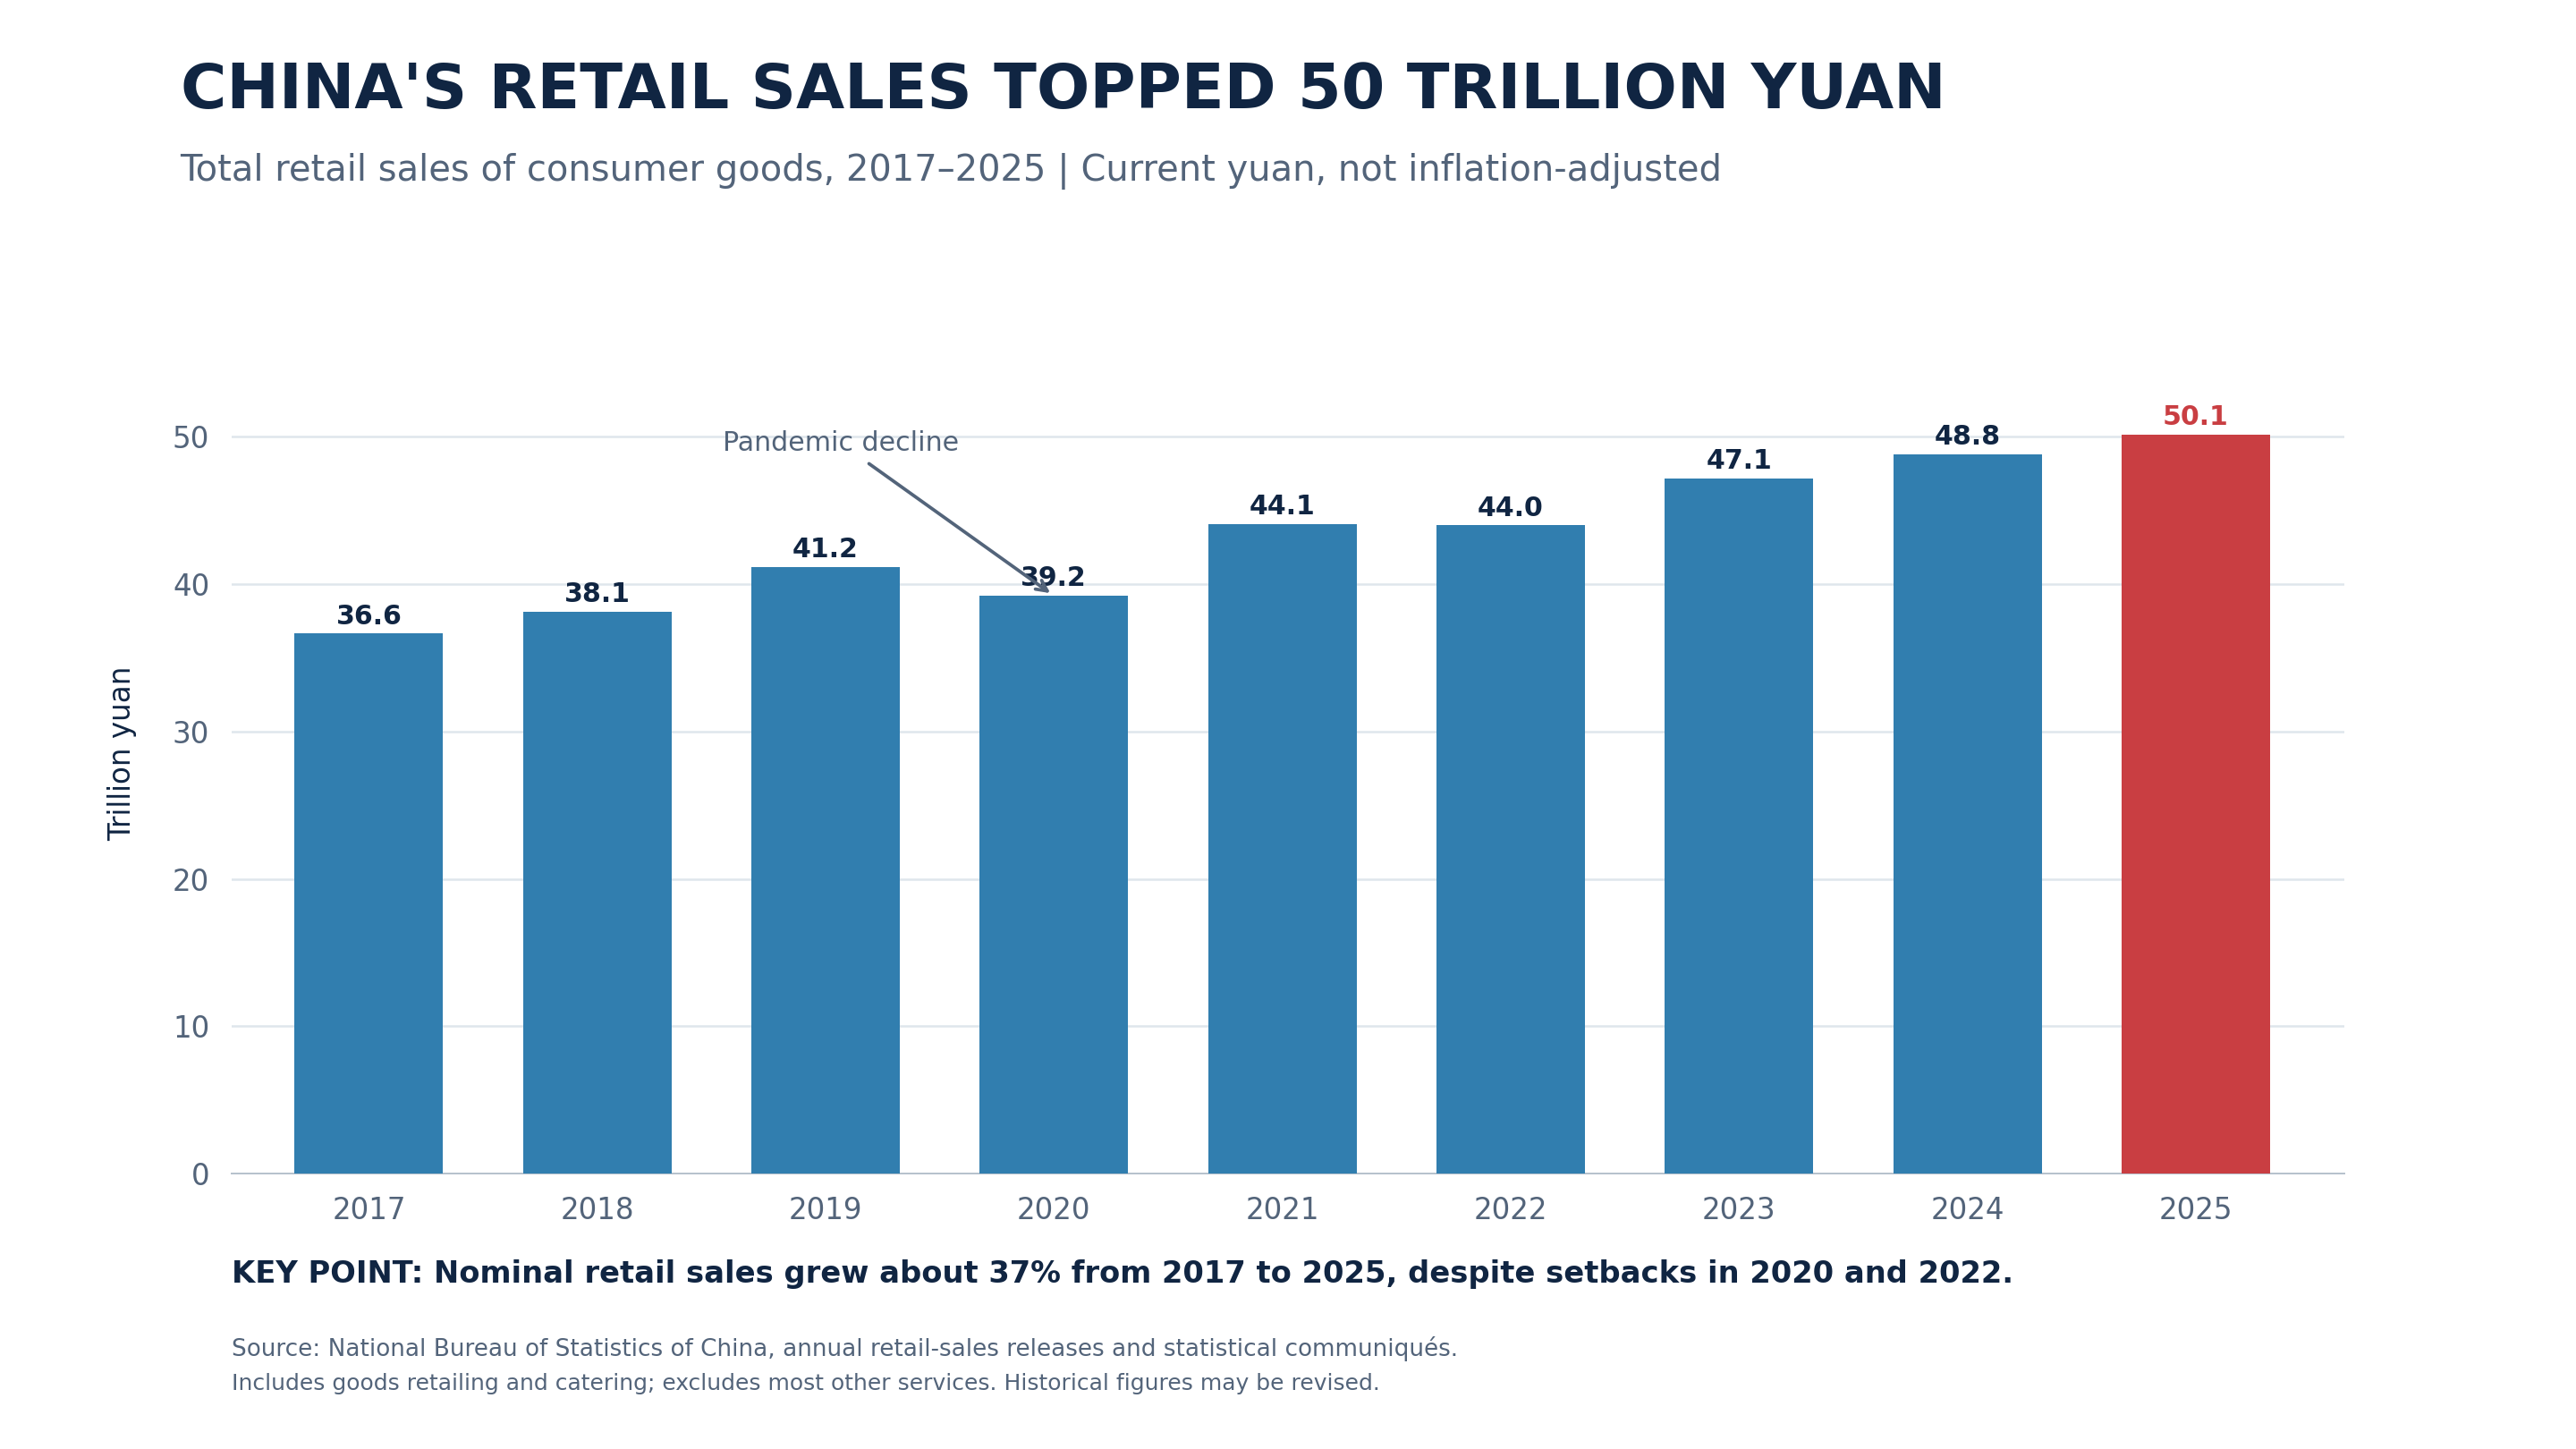
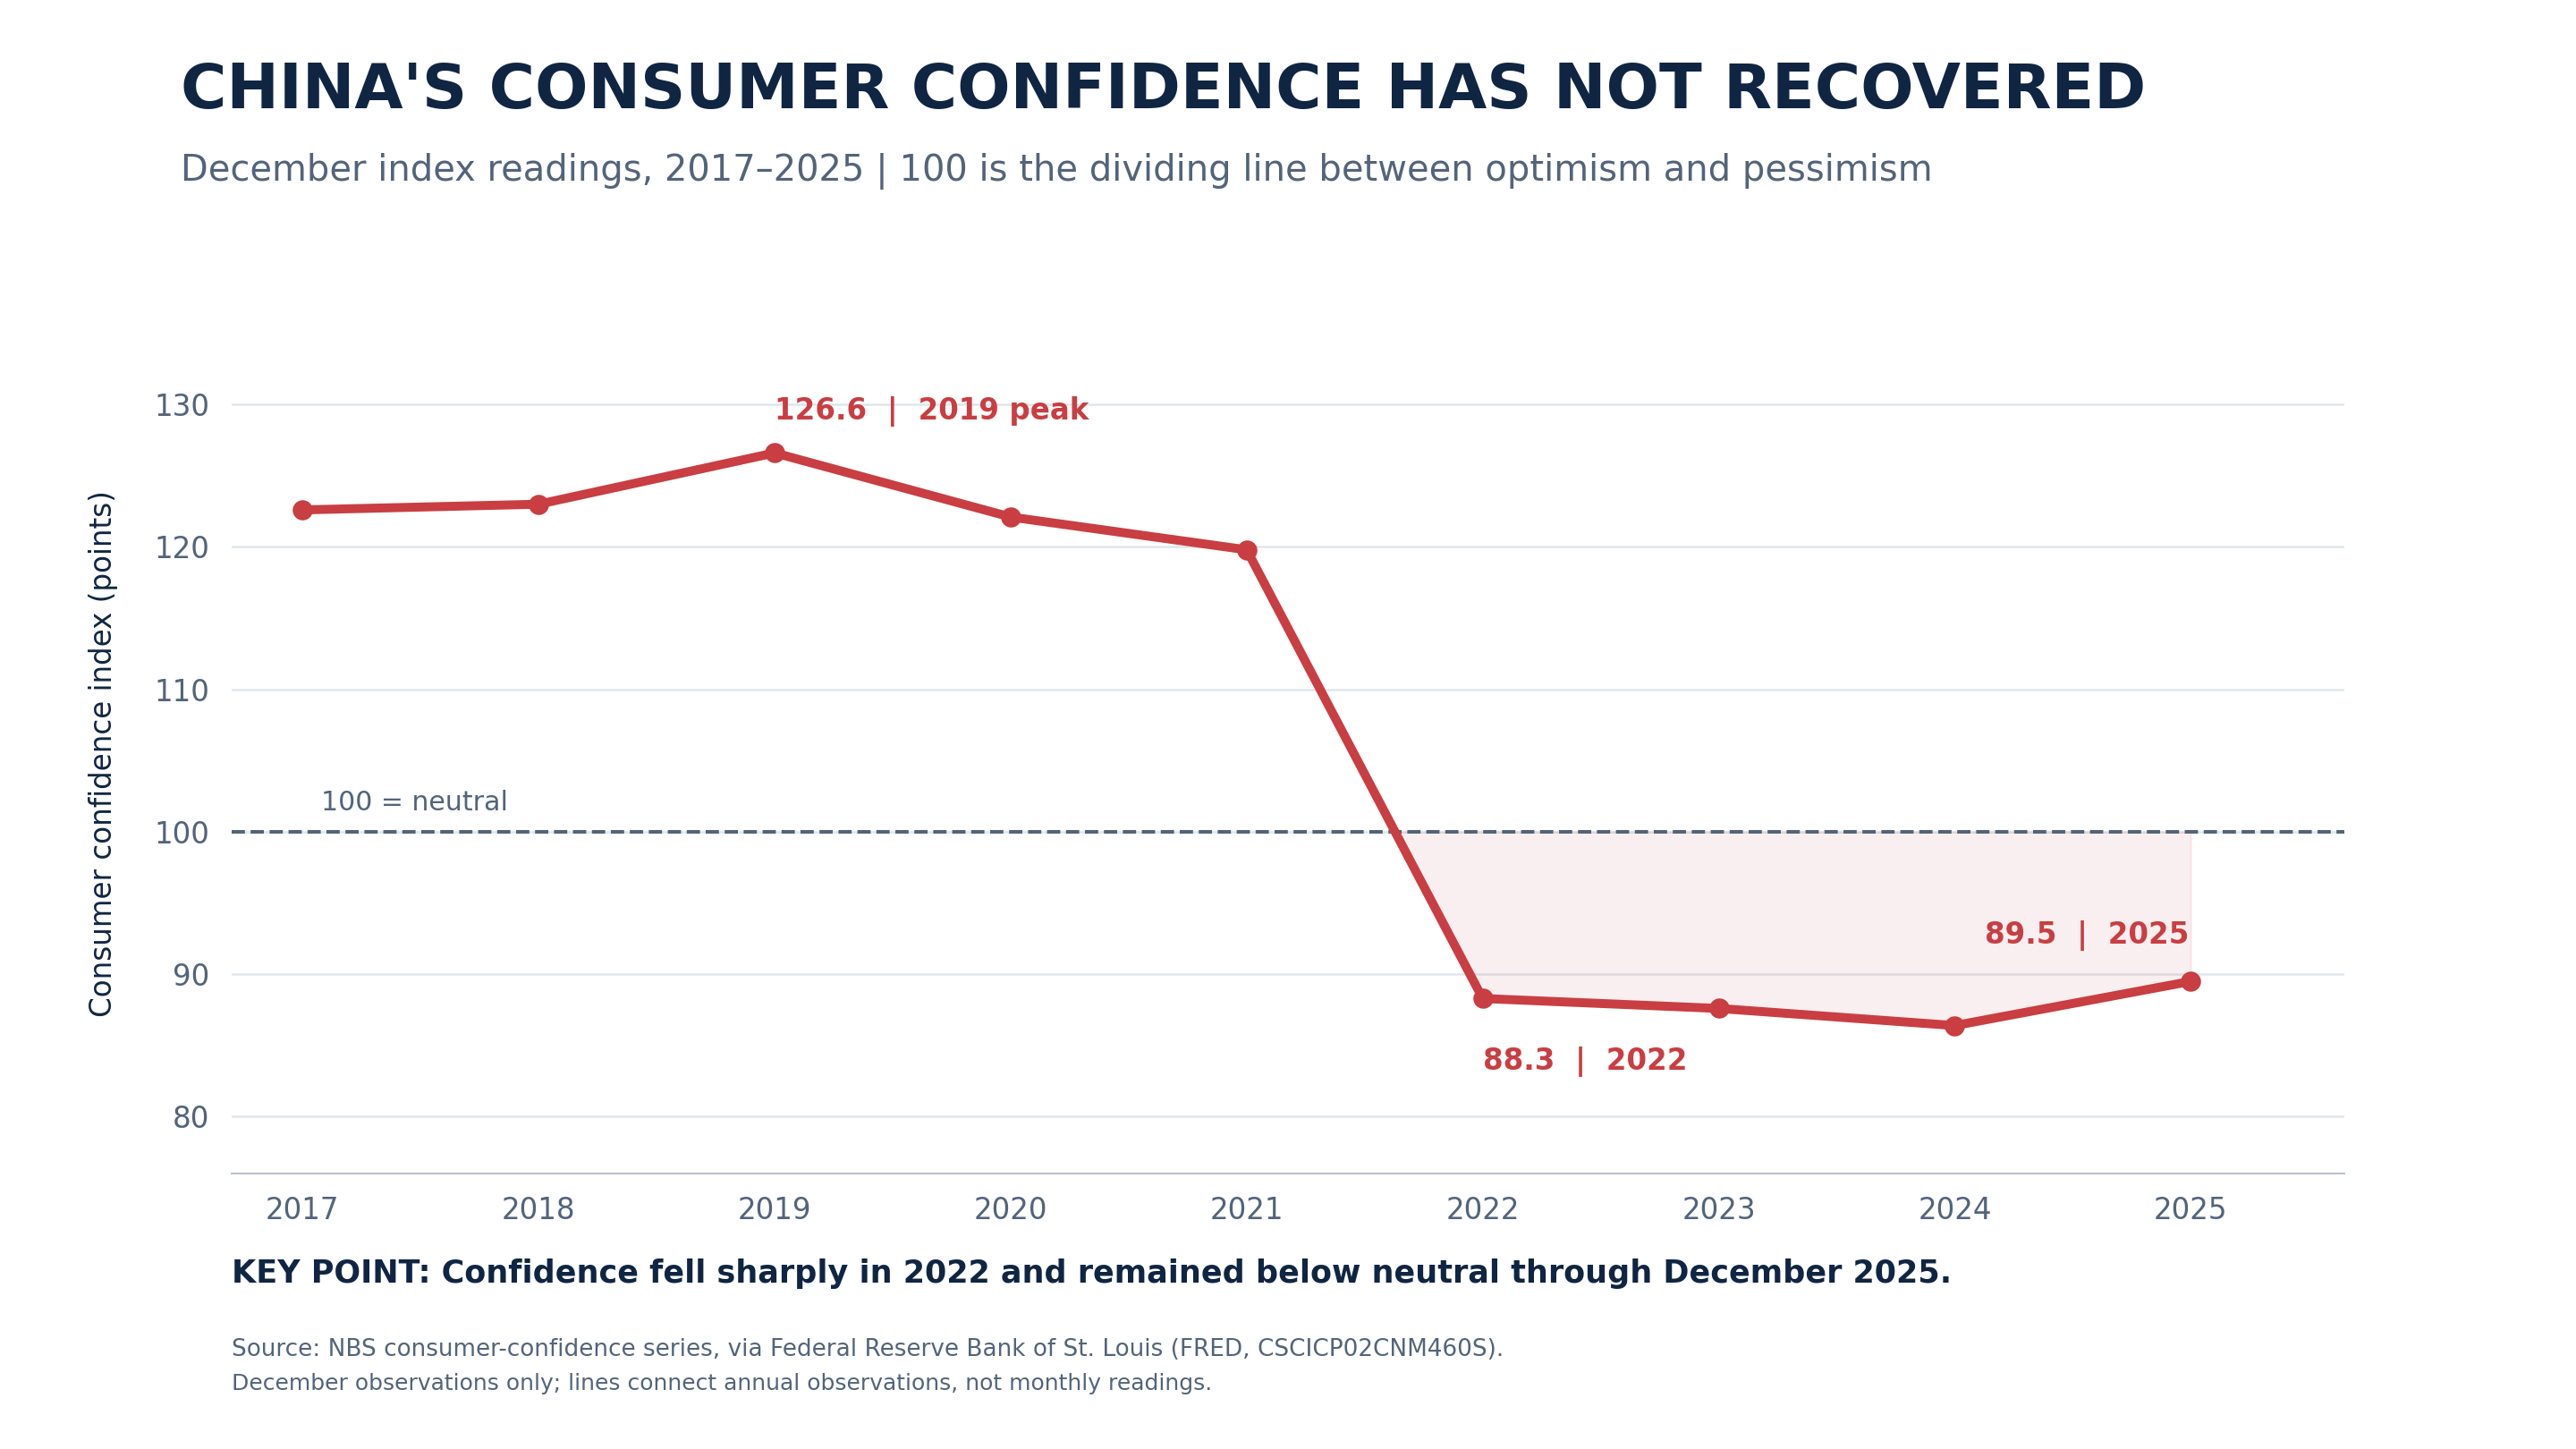
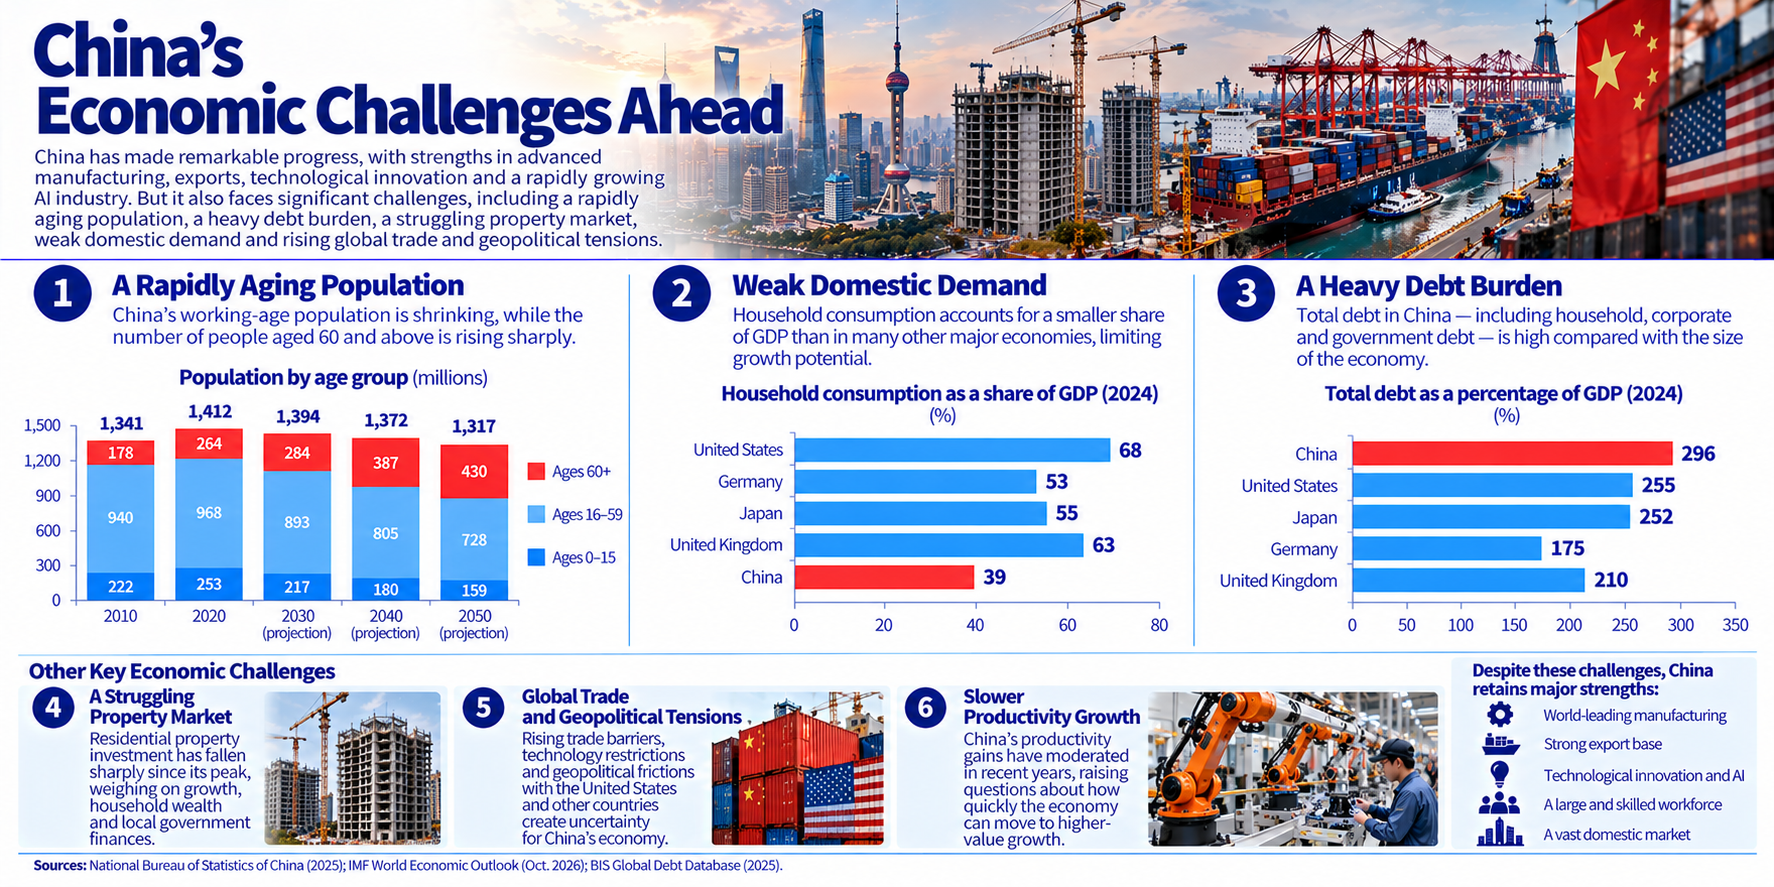
China’s economy is undergoing a profound transformation. The world’s second-largest economy remains a manufacturing powerhouse, a global trading giant and an increasingly important leader in emerging technologies. But beneath the impressive numbers lie significant challenges, including a struggling property market, weak consumer confidence, youth unemployment and simmering trade tensions.
Much of the global media coverage has tended toward the extremes: the rising economic power that will overtake the United States and end the American Century — or an over-levered, debt-fueled mess that cannot sustain the government-juiced growth of the past decade and is heading toward inevitable decline.
How can we make sense of these seemingly contradictory and overly simplistic visions?
Sometimes, the best way to understand a complicated economic story is to visualize it.
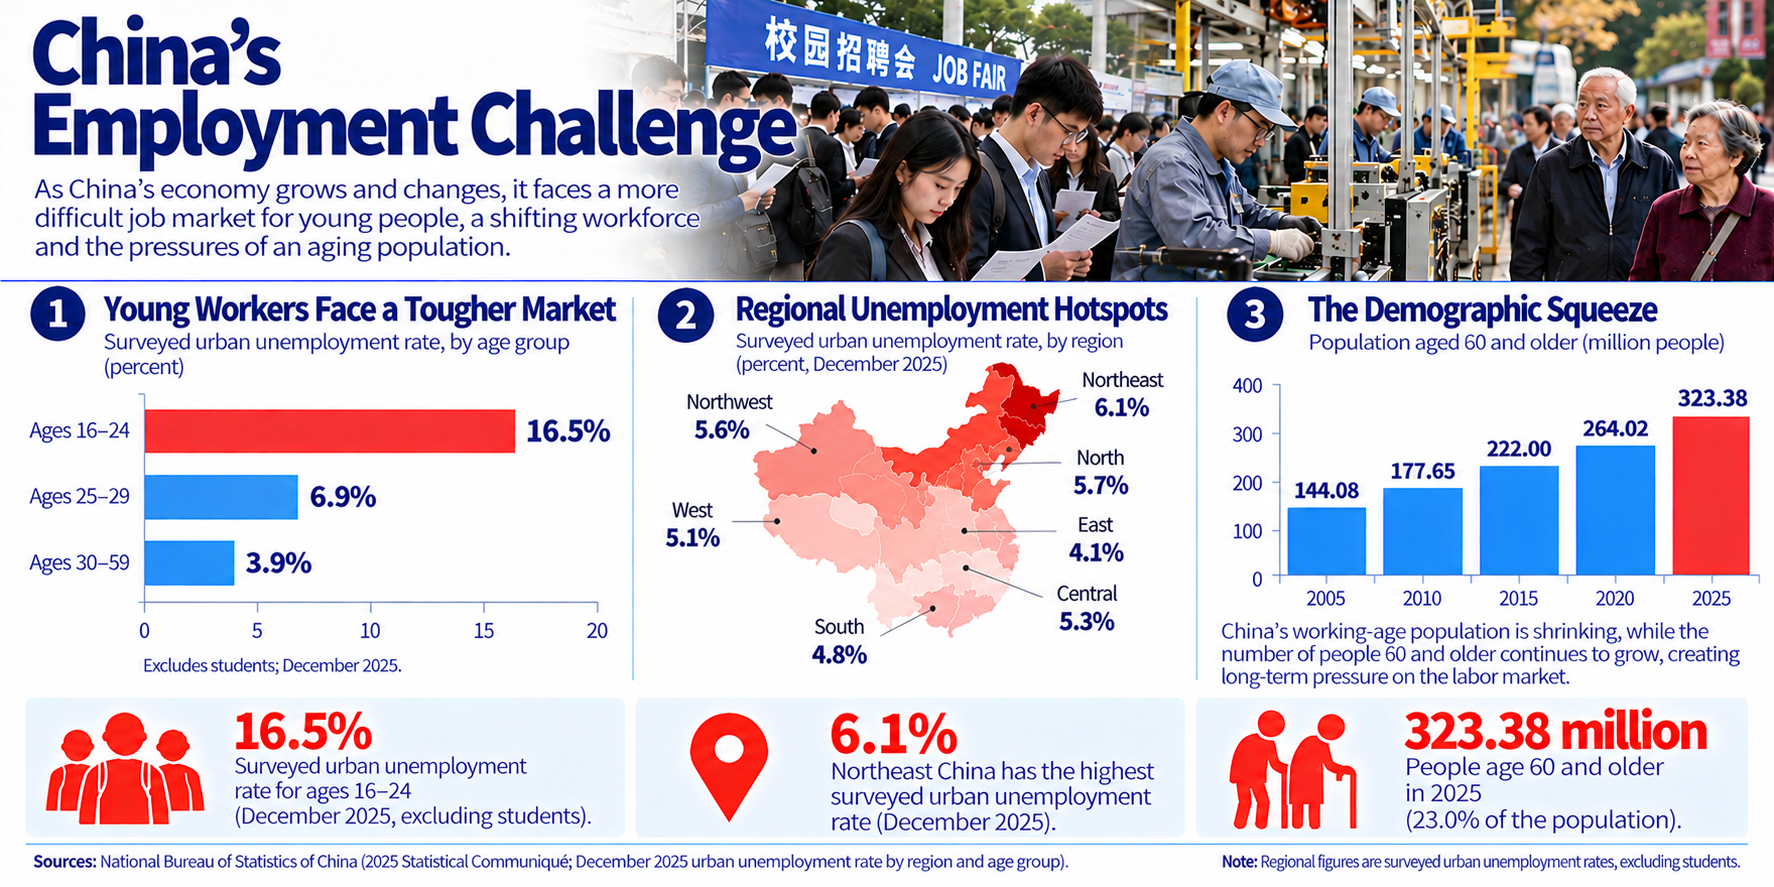
These 15 charts and infographics examine the state of China’s economy from several different perspectives. They explore the country’s changing economic structure, its expanding global trade relationships, the remarkable growth of electric vehicles and robotics, and its ambitions in artificial intelligence. They also examine the pressures facing Chinese households, workers, property owners and investors.
The graphics reveal an economy of striking contrasts: technological dynamism alongside structural weaknesses, global competitiveness alongside domestic uncertainty, and extraordinary industrial capacity amid questions about future growth.
No single statistic can adequately capture an economy as large and complex as China’s. Taken together, however, these visualizations provide a broader picture of where China stands today, how it got here and what may lie ahead.
They also demonstrate how data visualization can turn complicated economic statistics into accessible stories for an international audience. Enjoy! And please share your feedback and predictions.
Note: I used AI research to help me with find the latest data for this project. I tried to confirm all data that I used. If you see anything that is incorrect, please let me know and I will fix it.










12 essentials for creating effective digital stories
Posted: October 21, 2026 Filed under: Journalism Training, Rick's Rules | Tags: Journalism Training, multimedia journalism, data visualization, Multimedia Reporting, audience, journalism tips Leave a comment
By RICK DUNHAM
Writing for digital platforms requires different writing styles than the legacy news platforms it has eclipsed.
Readers who consume news on their phones or laptops prefer writing that is briefer and livelier than traditional print articles. Yet they want greater depth and insight than contained in a traditional television news report.
Here are 12 essential elements that will help you succeed in the digital news world.

1. No wasted words
There is no room for self-indulgence in digital writing. Every word matters. People click away from stories if they get bored or annoyed. If you write something and no one reads it, you are not an effective journalist in the digital age.
2. Think short
Short sentences. Write like you speak to a friend, not the way you’d write a report for a government agency or for a thesis.
Short leads. Don’t pack too many words into the first sentence. And don’t write it like a routine wire story lead: “Something happened today in our city, officials said.” Boring!
Short paragraphs. A screen containing one paragraph of dull, gray type is deadly. Vary paragraph lengths, but keep them to a maximum of three sentences.
One thought per paragraph. Don’t try to say everything all at once. Flow naturally from idea to idea. Keep the structure simple.
“A general rule of thumb: Web content should have about half as many words as its printed equivalent,” journalism trainer Tony Rogers has written.
3. Think visually
Don’t just think of the words you will write. Think of how it will look on the screen. You want it to be attractive visually. That means white space (and not just text). It means attractive and easy-to-understand graphics. And it means engaging and, ideally, shareable images.
4. Know your audience
Your writing may differ in subtle or significant ways based on your audience’s profile. Is it older? younger? more educated? more conservative? What is the audience’s nationality (or nationalities)? Is it regional or national within a country? Is it global? Does it have a particular interest in certain subject matter (economics, commerce, the environment, diplomacy)? , may write differently
5. Focus most items around a single theme
Forget about the traditional “kitchen sink” round-up story that deals with a number of developments on a single topic. Pick an important or engaging development and write a narrowly focused, compelling piece. If two or three developments are newsworthy and interesting to your audience, you can write multiple posts. Many news outlets combine these single-topic articles under the banner “the latest news on” today’s big story.
6. Be direct
Always use active sentence structure. Be conversational. Use strong verbs, precise nouns and as few adjectives and adverbs as possible. (Examples: Avoid wasted words like “very,” “a few” or “unfortunately.”) Never use stilted language or flowery prose. Get to the point. Always stay on point.
7. Be immediate
Make it clear quickly why someone would want to read your story now. Unless you are writing a long narrative that someone can bookmark and return to, you want to be immediate. Your target audience will either read it now – or never. Make it now!
8. Be more analytical
Try to add value, even in short stories. Provide analysis, context and even a bit of relevant history. Explain why something happened or what might happen next. Always consider what you might include that would make the reader leave you story thinking that they learned something interesting.
9. Use more lists and “bullet points”
Articles made up of lists, or structured to include a list of “bullet points” (the big dots that resemble bullets), are easier on the eye. They also save space by eliminating transition sentences from one thought to the next. Another plus: Younger audiences (age 35 and under) are particularly drawn to these so-called “listicles.”
10. Liberally insert links
Your digital stories can be easier to find on search engines if you include embedded links in your story. Embedded links have an added advantage: They save space by allowing you to link to background material rather than describing it in your own story. In addition to embedded links, keep people on your app or website by linking to related stories or other articles by the author.
11. Consider embedding social media posts and videos in your stories
Digital stories don’t have to be use a single storytelling medium. By embedding social media posts, short videos or even mini-documentaries in your post, you create a user-friendly multimedia melange.
12. Find your voice
Write like a person, not like a computer. Sound like you are someone the reader would like to know. It’s OK to include some “personality” in the story, as long as the personality is inviting. But don’t let that personality interfere with – or overwhelm – the main points of your article.
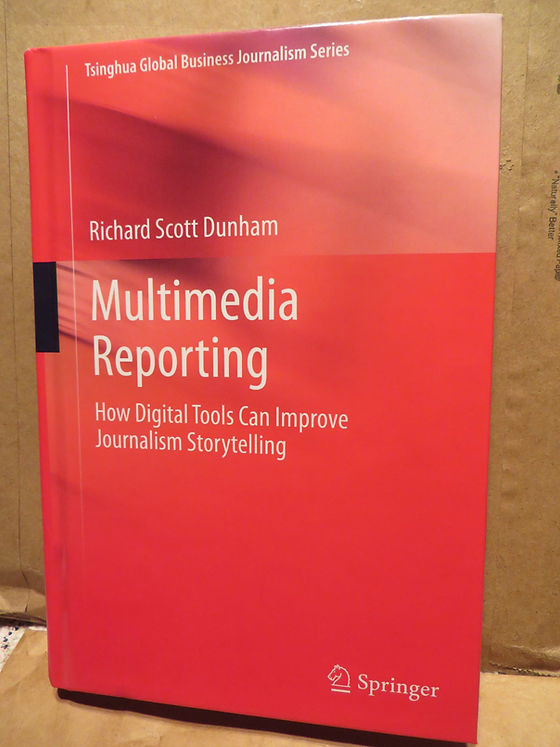
Rick Dunham is co-director emeritus of the Global Business Journalism program at Tsinghua University and a visiting professor in the Tsinghua School of Journalism and Communication. He is the author of the textbook, “Multimedia Reporting,” published globally by Springer, and co-editor of “The Routledge Companion to Business Journalism.”
Mr. Dunham is a veteran Washington journalist, White House correspondent and former president of the National Press Club. He also served as Washington bureau chief of the Houston Chronicle and White House correspondent for Business Week magazine.
Mr. Dunham has offered news analysis for news outlets from countries including the United States, China, Finland, the Philippines, Denmark, Estonia and Russia. He has trained professional journalists, journalism students and journalism educators in locations including the United States, China, Finland, the Netherlands, Hong Kong, Lebanon and the Philippines.
Explaining the Trump TACO phenomenon (video)
Posted: October 19, 2026 Filed under: Dunham's Discourses, U.S. politics | Tags: American politics, Donald Trump, economics, international trade, tariffs, trade, trade war Leave a commentEver since Donald Trump launched his global trade war in January 2025, there has been a cycle of threats, tariffs and retreats. Critics have dubbed this the “TACO” effect: Trump Always Chickens Out.
What is the logic behind the American president’s actions? And why do his detractors believe his trade policy resembles the widely popular Mexican fast food staple?
In this YouTube video explainer, I tackled this politically tricky and economically confusing question.
How to nail data journalism with compelling storytelling
Posted: October 17, 2026 Filed under: Journalism Training, Rick's Rules | Tags: audience, Data Journalism, data visualization, SEO, storytelling, writing Leave a comment
By RICK DUNHAM
In today’s digital landscape, data journalism stands as a powerful tool in uncovering truths, engaging audiences, and informing the public. However, presenting data merely as numbers and charts can often lead to dry content that fails to resonate. Effective storytelling in data journalism transforms raw data into compelling narratives that capture attention and inspire action.
Here are some of the essential elements that make storytelling an effective tool in the realm of data journalism.
Understanding the data
The first step in crafting a story from data is to deeply understand the information at hand. This means not just knowing the figures but also grasping their implications and the larger context. Analyzing the data helps in identifying patterns, trends, and anomalies.
When you understand your data, you’re better equipped to explain what it reveals. Think of the journey your readers will take: you want to guide them through the maze of numbers and lead them to meaningful insights.
The power of visuals
Incorporating visuals such as charts, graphs, and infographics can significantly enhance your storytelling. A visual representation can often convey complex data more effectively than paragraphs of text. By integrating visuals, you allow your readers to see the story in a different light, engaging them on both a visual and intellectual level.
Make sure your visuals are clear, relevant, and accurately represent the data. Avoid clutter by focusing on one main idea per visual. A well-designed infographic can distill comprehensive information into digestible bites, allowing the reader to grasp key points quickly.

Finding the human element
One of the most effective storytelling techniques in data journalism is connecting numerical data to real-world human experiences. Data can often seem impersonal, but tying statistics back to individuals or communities makes the data relatable and emotionally engaging.
Consider interviews or testimonials that illustrate the human impact behind the numbers. For instance, a data-driven story about unemployment rates can be strengthened by including personal narratives of individuals who have faced those challenges. Fictionalizing the data with real-life contexts creates a bridge between the cold hard facts and the reader’s heart.
Identifying and crafting a narrative arc
Every good story has a beginning, middle, and end. In data journalism, it’s important to structure your narrative effectively. Start with a compelling hook that draws in your audience and piques their curiosity. This could be an intriguing statistic or a provocative question.
Once you’ve captured their attention, delve into the data, presenting it in a logical flow. Use subheadings, bullet points, and concise paragraphs to make the information easily digestible. Finally, conclude with a powerful ending that reinforces your main message and leaves a lasting impression.
The role of context
Providing context is critical in helping readers understand the significance of the data you’re presenting. Data doesn’t exist in a vacuum; it is affected by numerous factors that shape its meaning.
For example, when reporting on climate change statistics, contextualizing the data with historical trends, related policies, and current events can enrich the story. Ensure you clarify why the data matters and how it relates to broader societal issues.
Engaging your audience
To maintain reader engagement, consider incorporating interactive elements wherever possible. Think about ways to invite the audience to participate, be it through comments, social shares, or surveys about their reactions to your data.
Asking questions can encourage readers to engage with the material more actively. For example, “What do you think about this trend?” or “Have you experienced something similar?” can motivate audience interaction and foster community discussion around your story.
SEO considerations
In the digital era where content is constantly competing for attention, it’s essential to make your posts search-engine optimized (SEO). Use relevant keywords naturally within your content to enhance visibility.
This includes incorporating terms related to data journalism within headings, subheadings, and body text, but remember to maintain the flow of the narrative. The goal is to inform and engage your readers while also making it easier for them to discover your work online.
Data journalism storytelling
Effective storytelling in data journalism is about connecting with your audience on a deeper level, making complex data understandable, and infusing human experiences into statistics. By mastering narrative techniques, embracing visuals, and providing context, you can transform ordinary data reporting into compelling stories that resonate with your readers.
As you continue your journey in data journalism, remember: the magic is not just in the data itself, but in how you tell the story. Strive for clarity, empathy, and engagement, and watch as your data-driven narratives captivate and inform your audiences.
How you can improve your writing through self-editing
Posted: October 16, 2026 Filed under: Journalism Training, Rick's Rules | Tags: Journalism Training Leave a comment
Cyndi Hughes is president of Cynthia Hughes Literary Consulting. This article is adapted from her lecture to Rick Dunham’s News Writing course.
Editing is where the magic happens — it’s the other half of writing. It’s the hidden, or behind-the scenes, process you use to craft your story.
Editing is like putting together the pieces of a story puzzle. The process of editing hones the message or theme that you want to convey. It removes distractions for readers that can undercut your credibility as a writer. It makes the story clearer and more concise. It often ensures the story “fits” the space allocated for it. It checks for adherence to grammar, spelling, punctuation and style guidelines. And it ensures factual accuracy.
Editing involves “big-picture” and “small picture” facets.
The “big-picture” review is often called developmental or content editing. This process includes reviewing:
- the theme or premise (What is the overall point of the story?)
- the story’s structure (Does the narrative structure convey the story’s theme and tell the story in a compelling way? If not, could the story be structured in a more effective way?)
- the supporting facts (Do the facts in the story build a clear case for the theme?)
- any missing information (Does the story have gaps that undercut the theme?)
“Small-picture” editing involves two other forms of editing: copyediting and proofreading:
- Copyediting makes sure that grammar, spelling, punctuation and tenses are correct and that your story conforms to style guidelines. It also watches for factual errors, missing information or continuity problems.
- Proofreading is a final pass to catch any remaining errors and includes checking embedded links and double-checking of dates, names, and titles.
As a writer, one of the best skills you can learn is how to self-edit your work before submitting it to your editor. Editing yourself is one of the hardest things to do in journalism.

Learning how to edit can happen by osmosis: If you read enough good stories and work with good reporters, editors, mentors and professors, you will start developing an innate sense of story structure. To become a good editor, you need to put in your time. Remember writer Malcolm Gladwell’s “10,000 hours rule” and invest the time required to hone your editing skills.
One way to start learning is to pay attention to the feedback you get from other reporters and editors. Understanding the feedback you receive will improve your writing and your skill set over time. When you begin, remember this: Don’t take feedback or criticism personally. Editing is a team sport, and you, your colleagues, and your editors all working together to put out the best content for your readers.
Over time, you’ll start thinking like an editor whenever you’re reading stories by other reporters, reading books, listening to podcasts, or watching television news and even movies and television shows.
Here’s a self-editing checklist you can use:
- Start by being kind to yourself. The first (or even the second or the third) draft of your story is rarely your final draft. And that’s okay. From then on, you’re editing and rewriting.
- Make sure your story has covered the 5 Ws and 1 H. (Who? What? When? Where? Why? How?)
- Examine your story’s structure and make sure it aligns with the story-structure expectations for whatever news outlet you’re working for.
- Double-check all facts and sources and do not take any facts for granted. Remember the famous journalism saying: “If your mother says she loves you, check it out.” Find additional sources as needed.
- Make sure all verbs and subjects agree. Examples: Agatha Christie and Ellery Queen is my favorite mystery author. (No, they ain’t.) Facebook is changing their algorithms again. (No, they are not.)
- Be ruthless with adjectives and adverbs. When in doubt, delete. Examples: “Bill deceptively stepped back and then carefully took a shot from 6 meters away.” Just delete the adverbs. As American author Stephen King says, “The road to Hell is paved with adverbs” – and we can add “adjectives” to that!
- Avoid passive voice and use active voice. Example: “Curiosity killed the cat” instead of “It was curiosity that caused the cat to be killed.” Save space. Be clearer. Polish your prose and use simple, direct language with strong nouns and active verbs.
- Eliminate wasted words. Rewrite any sentences starting with “There is” or “There are.” Delete words like “now,” “currently,” “presently,” “really,” “very” or other redundant words.
- Check spelling. And remember, the dictionary is your friend!
- Check punctuation. A magazine once printed this comma-deficient headline: “Rachael Ray finds inspiration in cooking her family and her dog.” (Let’s hope she didn’t cook her family and her dog.)
- Make sure all quotations and facts include correct attribution.
- Make sure verb tenses are consistent. Most journalism stories are written in simple past tense and present continuous. Don’t jump back and forth between past and present tenses.
- Review your story for compliance with style guidelines. English news writing style varies around the world. American, British, Canadian, Australian, South Asian news outlets have distinct styles. It is important to know which style guidelines are used by your news outlet. (Global Business Journalism uses Associated Press and Bloomberg News style manuals.) Be consistent. Style rules are not “mix and match.”
- Use placeholders for anything you need to track down or confirm. If you’re editing and keep stopping to find missing information, that interrupts your editing flow. Finish your editing “pass” first, then add those missing pieces. Professor Rick Dunham uses “TK” for details that are “to come.” Some journalists use “xx” for missing facts and “00” for missing numbers. Make sure to fill in those facts before publication.
- Check continuity. The story should flow naturally from section to section. Avoid lazy transitions (“meanwhile,” “but,” “on the other hand,” “in other business”).
- Before submitting your work, proofread it: Read a story from the bottom to the top or from right to left (or left to right, depending on your preferred language) to look for typographical errors and final small problems.
Perhaps the most important editing skill you can develop is paying attention to your own Inner Reader whenever you’re reading anything or watching movies or television:
- Where do you get bored?
- Where does the story zip along for you?
- Where do you stop reading — and what brought you to a halt?
- When do you start screaming in delight, “Whoa! I didn’t see that coming!”
- When do you throw the book or magazine across the room or hit “stop” on your remote?
- When do you get to “The End” and immediately turn back to the beginning to start rereading the book or re-watching the movie again?
At first, you might think you don’t have an Inner Reader, but just keep listening for it. It will appear.
One final tip: Find a mentor! Working with an experienced reporter or editor and reading behind him or her is priceless and one of the best ways to learn about editing.
Cyndi Hughes is president of Cynthia Hughes Literary Consulting. She is a former copy chief and deputy executive editor at Texas Monthly magazine and copy chief for the Austin American-Statesman’s Features section. She is the founding director of the Texas Book Festival and the former executive director of the Writer’s League of Texas.
Her email is cyndi.hughes@hughesliterary.com.


Recent Comments